Advertisement
- United States
- /
- Electronic Equipment and Components
- /
- NasdaqGS:TTMI
Does TTM Technologies Rally Signal More Gains Ahead After Latest Defense Contract Win?

Simply Wall St
Reviewed by Bailey Pemberton
Thinking about what to do with TTM Technologies stock right now? You are not alone. Whether you already hold shares or are eyeing a potential entry, the decision feels more important than ever, given how fast the stock has moved. Over just the past week, TTM Technologies has climbed 7.0%, and if you look back thirty days, the rally stretches to 25.3%. Year to date, the stock is up a stunning 126.9%, putting a resounding exclamation mark on a five-year gain of 387.2%. That kind of momentum gets everyone talking, from investors to analysts and even casual market watchers who may be wondering if the story has more room to run.
None of these dramatic price surges happened in a vacuum. Investors and industry insiders have been buzzing about the company’s position as market demand for advanced electronics manufacturing continues to evolve. This has helped reshape expectations and, arguably, even the risk-reward profile for TTM shares.
But before you get swept away by the bullish narrative, it is worth pausing to consider one important perspective: valuation. After all, no matter how exciting a stock’s trajectory, the real question is whether the price you pay today leaves you a reasonable margin for future gains. Our valuation score for TTM Technologies is currently 0 out of 6, meaning the company does not show signs of being undervalued by any of the six key methods we track.
Of course, standard valuation checks can tell you a lot, but sometimes, they miss deeper truths about a company’s unique position and prospects. Let us dig into those valuation approaches while keeping an eye out for an even smarter way to assess true value by the end of this article.
TTM Technologies scores just 0/6 on our valuation checks. See what other red flags we found in the full valuation breakdown.Approach 1: TTM Technologies Discounted Cash Flow (DCF) Analysis
The Discounted Cash Flow (DCF) model estimates a company’s intrinsic value by projecting its future free cash flows and then discounting those cash flows back to today’s value. For TTM Technologies, this model uses cash flow projections based on recent figures and analyst expectations, supplemented by further estimates for years beyond the typical forecast horizon.
Currently, TTM Technologies is generating free cash flow of roughly $50.2 Million. Recent analyst estimates project this growing steadily, reaching $95.1 Million by the end of 2027. Looking further ahead, extrapolated forecasts suggest annual free cash flow could rise to over $170 Million within a decade. All of these cash flows are considered in dollars, as the company reports its numbers in USD.
After accounting for these future projections and discounting them to today’s terms, TTM Technologies’ DCF-derived intrinsic value per share is calculated at $21.54. Compared to the current market price, the model suggests the stock is trading at a 159% premium. This means it appears significantly overvalued according to the DCF approach.
Result: OVERVALUED
Head to the Valuation section of our Company Report for more details on how we arrive at this Fair Value for TTM Technologies.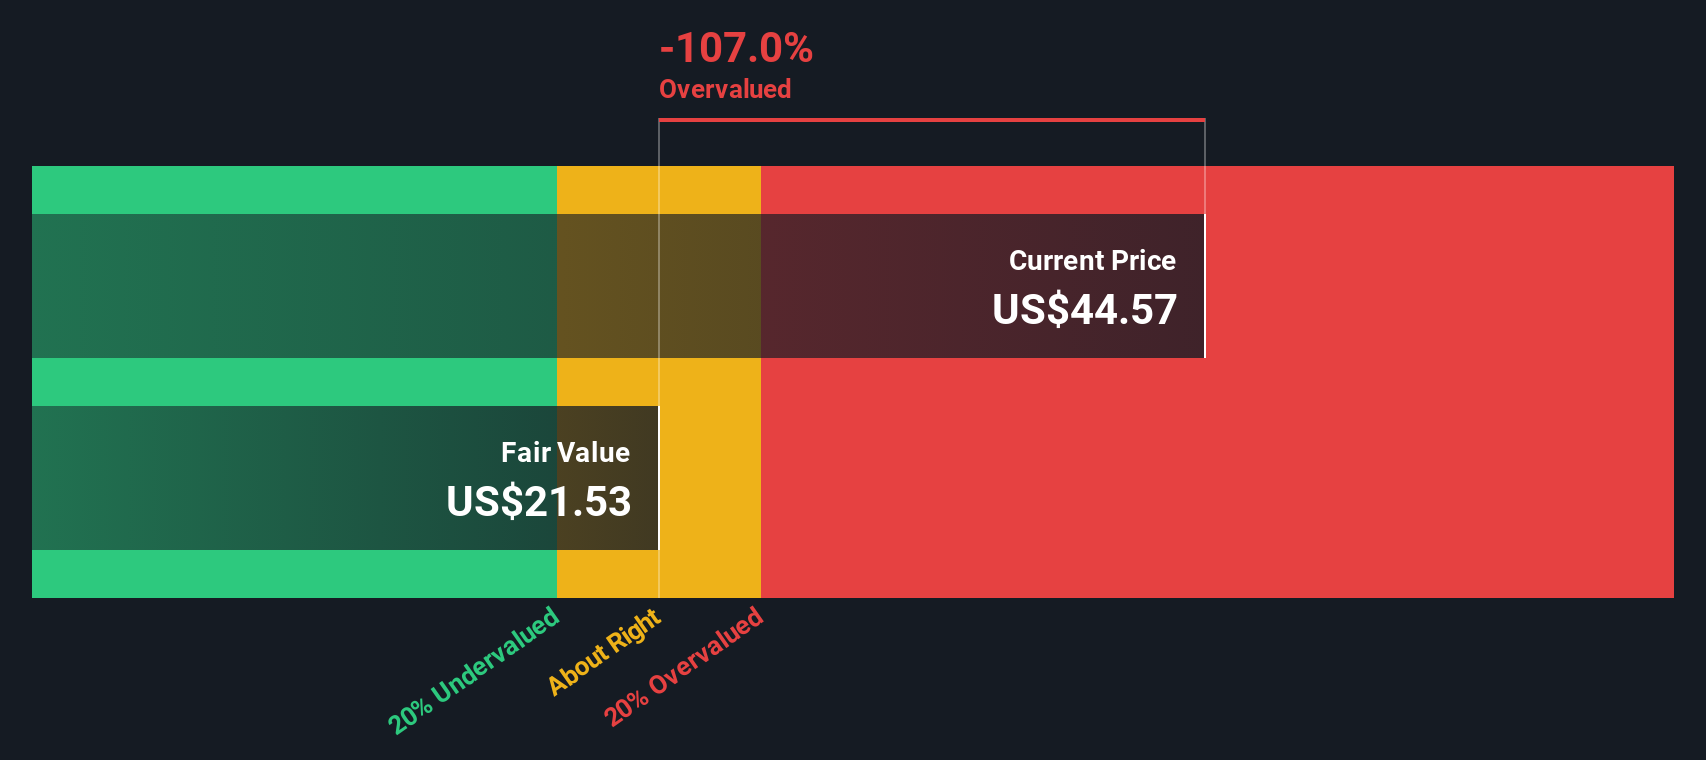
Approach 2: TTM Technologies Price vs Earnings
When assessing the valuation of a consistently profitable company like TTM Technologies, the Price-to-Earnings (PE) ratio is generally the go-to metric. The PE ratio helps investors understand how much they are paying for each dollar of the company’s profits. Not all companies are the same, so growth expectations and risk are crucial in determining what a “normal” or “fair” PE ratio should actually be. Fast-growing, stable companies typically command higher PE ratios, while those with more risk or slower growth deserve a lower multiple.
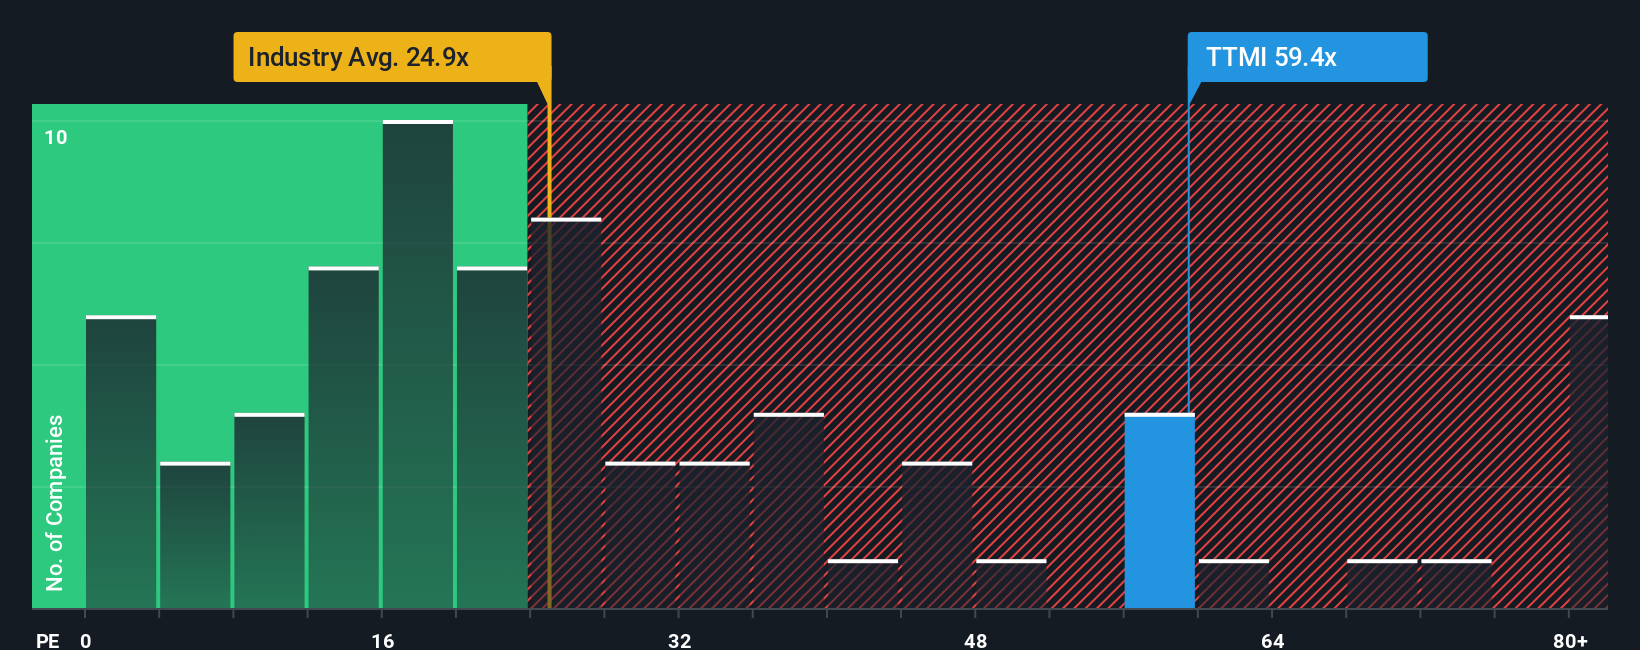
Currently, TTM Technologies trades at a hefty 61.8x earnings. For context, the average PE for its electronic industry peers is just 23.95x, and the direct peer group averages around 30.48x. At first glance, this makes TTM seem very expensive compared to its surroundings.
Simply Wall St’s proprietary “Fair Ratio” aims to offer more nuance than a simple peer comparison. The Fair Ratio, set here at 34.53x for TTM Technologies, adjusts for factors like earnings growth, profitability, market cap, and potential risks. This provides a more tailored benchmark specific to the company’s unique profile. This approach offers a better context for investors since industry averages can overlook key company differences.
Since TTM’s current PE of 61.8x is well above its Fair Ratio of 34.53x, the stock appears overvalued according to this multiple-based approach.
Result: OVERVALUED
Upgrade Your Decision Making: Choose your TTM Technologies Narrative
Earlier, we mentioned that there is an even better way to understand valuation. Let us introduce you to Narratives. A Narrative is your unique story behind the numbers, letting you define what you believe about a company’s future, such as its revenue growth, profit margins, and how these shape its fair value estimate, while making your reasoning transparent and easy to revisit as things change.
Instead of just crunching historical data or following analyst targets, Narratives connect your view of TTM Technologies’ business drivers straight to your financial forecast. This creates a living estimate of fair value tailored precisely to your outlook. Narratives are a core, user-friendly feature in the Community page on Simply Wall St, used by millions of investors worldwide. Anyone can align their decision making with their own research and perspective, not just market consensus.
Narratives help you decide when to buy, hold, or sell by continually comparing your Fair Value with TTM’s current price and automatically updating as new news, results, or industry events occur. For example, one investor may create a bullish Narrative for TTM, seeing resilient defense demand, robust data center growth, and assign a fair value of $59 per share. Another might focus on rising costs and margin pressure, estimating fair value far lower. You can always see and compare a wide range of up-to-date perspectives in real time.
Do you think there's more to the story for TTM Technologies? Create your own Narrative to let the Community know!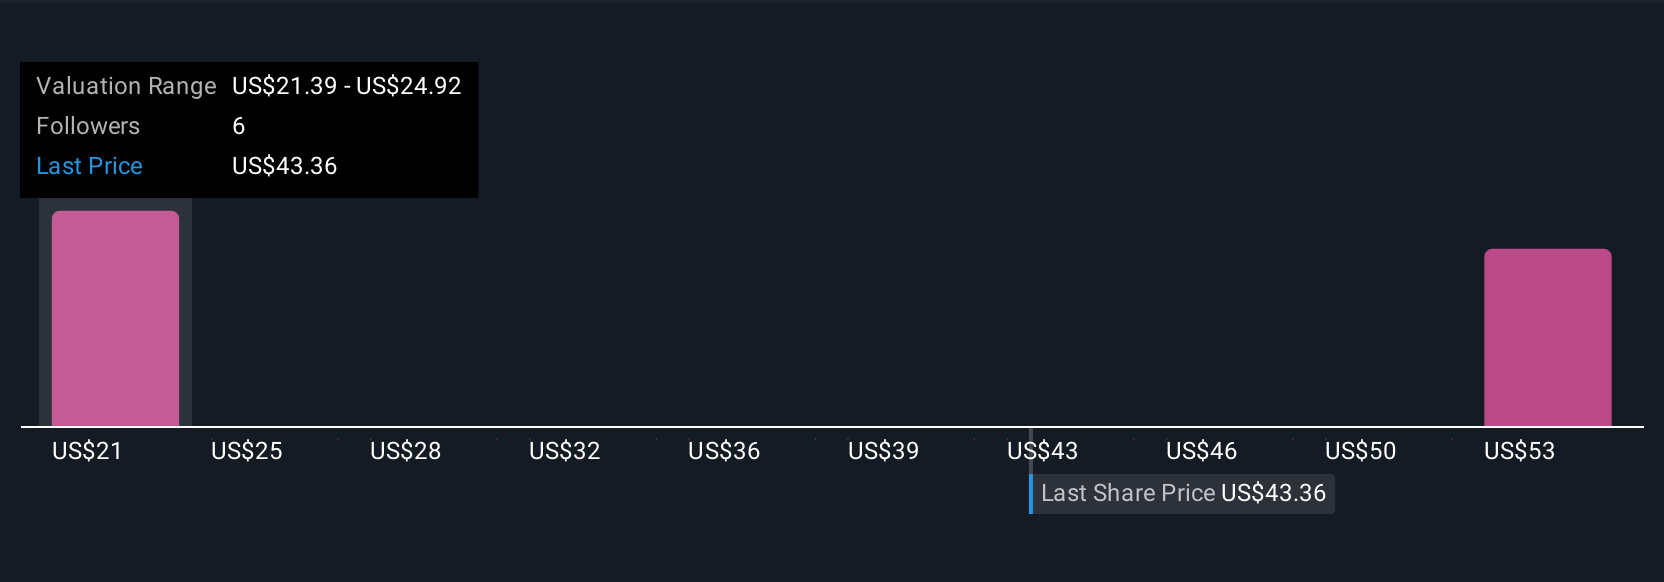
This article by Simply Wall St is general in nature. We provide commentary based on historical data and analyst forecasts only using an unbiased methodology and our articles are not intended to be financial advice. It does not constitute a recommendation to buy or sell any stock, and does not take account of your objectives, or your financial situation. We aim to bring you long-term focused analysis driven by fundamental data. Note that our analysis may not factor in the latest price-sensitive company announcements or qualitative material. Simply Wall St has no position in any stocks mentioned.
Valuation is complex, but we're here to simplify it.
Discover if TTM Technologies might be undervalued or overvalued with our detailed analysis, featuring fair value estimates, potential risks, dividends, insider trades, and its financial condition.
Access Free AnalysisHave feedback on this article? Concerned about the content? Get in touch with us directly. Alternatively, email editorial-team@simplywallst.com
About NasdaqGS:TTMI
TTM Technologies
Manufactures and sells mission systems, radio frequency (RF) components and RF microwave/microelectronic assemblies, and printed circuit boards (PCB) in the United States, Taiwan, and internationally.
Flawless balance sheet with proven track record.
Similar Companies
Market Insights

Advertisement
Community Narratives
A formidable player in AI and enterprise computing.
Fair Value US$210.00|2.3% overvalued
CO
Community Contributor
IREN's Bold Moves in Sustainable Bitcoin Mining & AI Data Centers
Fair Value US$72.52|17.6% undervalued
BL
Community Contributor
Cooling the Champions: The Aussie Tech Behind F1's Victories
Fair Value AU$12.40|40.4% undervalued
TR
Community Contributor