Advertisement
- United States
- /
- Electronic Equipment and Components
- /
- NasdaqGS:FLEX
Does Flex’s Expansion Into Renewables Signal a Mispriced Opportunity After Recent Price Swings?
SI

Reviewed by Bailey Pemberton
- Ever wondered if Flex’s share price actually reflects its true worth, or if there is a hidden value that the market is missing?
- The stock has seen a wild ride lately, with short-term drops of 8.5% over the last week and 8.3% in the last month. However, it is still up 49.1% year-to-date and 373.1% over five years.
- Recent headlines have focused on Flex’s strategic investments in supply chain solutions and expansion in renewable energy segments. This has fueled optimism around its growth prospects, while news of high-profile customer wins and industry partnerships has added further excitement even as volatility picks up.
- On the numbers front, Flex earns a 4 out of 6 on our valuation checklist for undervalued companies. Let’s examine what drives this score, how the standard valuation yardsticks compare, and why there may be a smarter way to judge Flex’s value by the end of this piece.
Approach 1: Flex Discounted Cash Flow (DCF) Analysis
A Discounted Cash Flow (DCF) model estimates a company’s intrinsic value by projecting its future cash flows and then discounting those values back to today’s dollars. For Flex, the DCF approach uses both analyst estimates and extrapolated projections to forecast how much cash the business will generate.
Flex’s most recent reported Free Cash Flow stands at $1.17 Billion. Analysts predict its Free Cash Flow will rise steadily, surpassing $1.34 Billion by 2028. Projections extending ten years, using a combination of actual analyst coverage and systematic estimates, see Free Cash Flow continue to increase, reaching approximately $1.92 Billion by 2035. All figures are stated in US dollars.
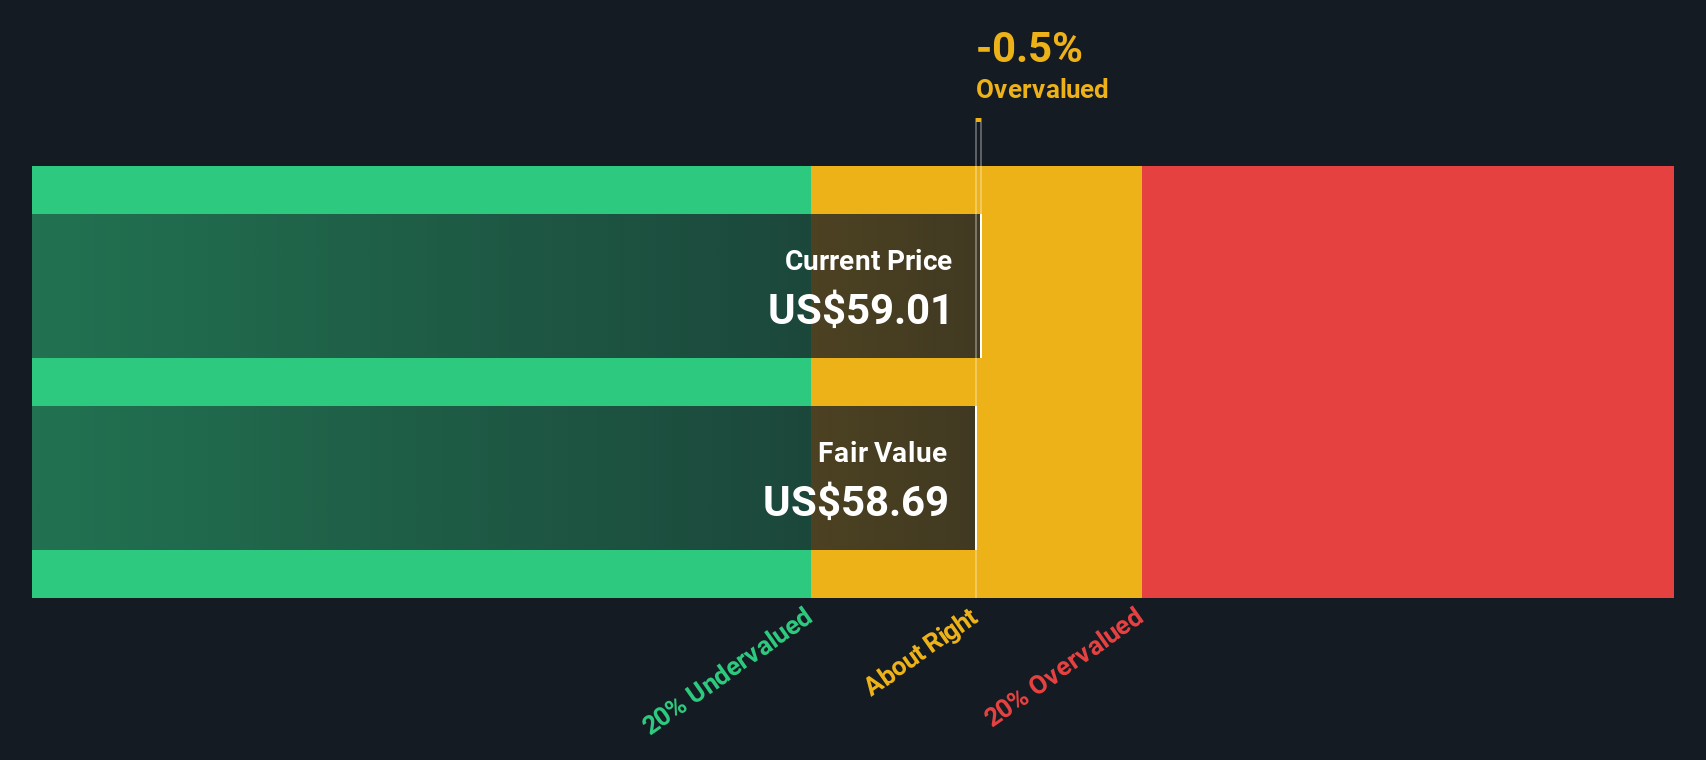
By discounting these future cash flows to the present, the DCF model calculates Flex’s intrinsic value at $65.14 per share. This figure is about 11.6% higher than the company’s current market price, which means, according to this model, the stock is undervalued.
Result: UNDERVALUED
Our Discounted Cash Flow (DCF) analysis suggests Flex is undervalued by 11.6%. Track this in your watchlist or portfolio, or discover 905 more undervalued stocks based on cash flows.
Approach 2: Flex Price vs Earnings
For companies that are consistently profitable, the Price-to-Earnings (PE) ratio is one of the most widely accepted ways to assess valuation. The PE ratio tells investors how much they are paying for every dollar of earnings, making it a favorite tool for gauging whether a stock might be expensive or cheap relative to its profits.
Higher growth expectations typically drive PE ratios up, as investors are willing to pay a premium for companies with strong earnings potential. On the flip side, higher risk or uncertainty tends to lower the "normal" or "fair" PE investors will accept.
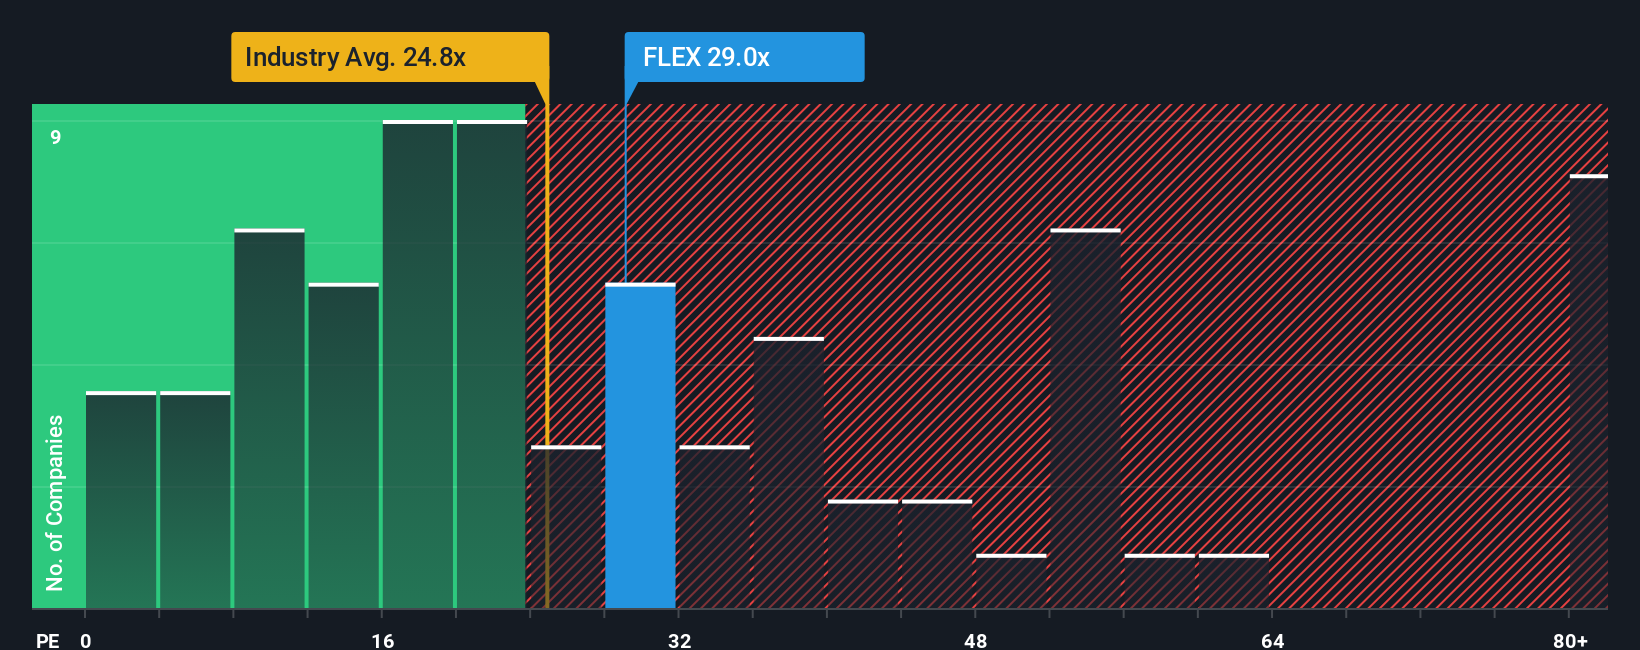
Flex currently trades at a PE ratio of 24.3x. For comparison, the Electronic industry average stands at 22.8x, while Flex's peer average is significantly higher at 36.4x. These benchmarks provide some context, but they do not account for factors unique to Flex.
This is where the “Fair Ratio,” Simply Wall St’s proprietary benchmark, comes in. The Fair Ratio for Flex is 34.8x, calculated based on the company’s earnings growth outlook, its industry, profit margin, market cap, and risk profile. Unlike plain comparisons to peers or the industry average, this customized multiple aims to present a more tailored picture of what Flex’s valuation should be, considering all the relevant nuances.
With Flex's actual PE ratio (24.3x) well below its Fair Ratio (34.8x), the numbers suggest the stock is undervalued on this basis.
Result: UNDERVALUED
PE ratios tell one story, but what if the real opportunity lies elsewhere? Discover 1420 companies where insiders are betting big on explosive growth.
Upgrade Your Decision Making: Choose your Flex Narrative
Earlier we mentioned that there is an even better way to understand valuation, so let’s introduce you to Narratives. A Narrative is your personal investment story. It connects your unique view of a company’s future (how fast it might grow, what its margins could be, what its risks and opportunities are) with the actual numbers behind its forecast and what you believe is a fair value today.
Instead of relying solely on valuation models or analyst targets, Narratives empower you to build your own conviction by linking Flex’s story to its financial forecast. On Simply Wall St’s Community page, Narratives are an easy and accessible tool used by millions of investors to share, compare, and discuss their perspectives. They dynamically update as new news, results, or surprises emerge.
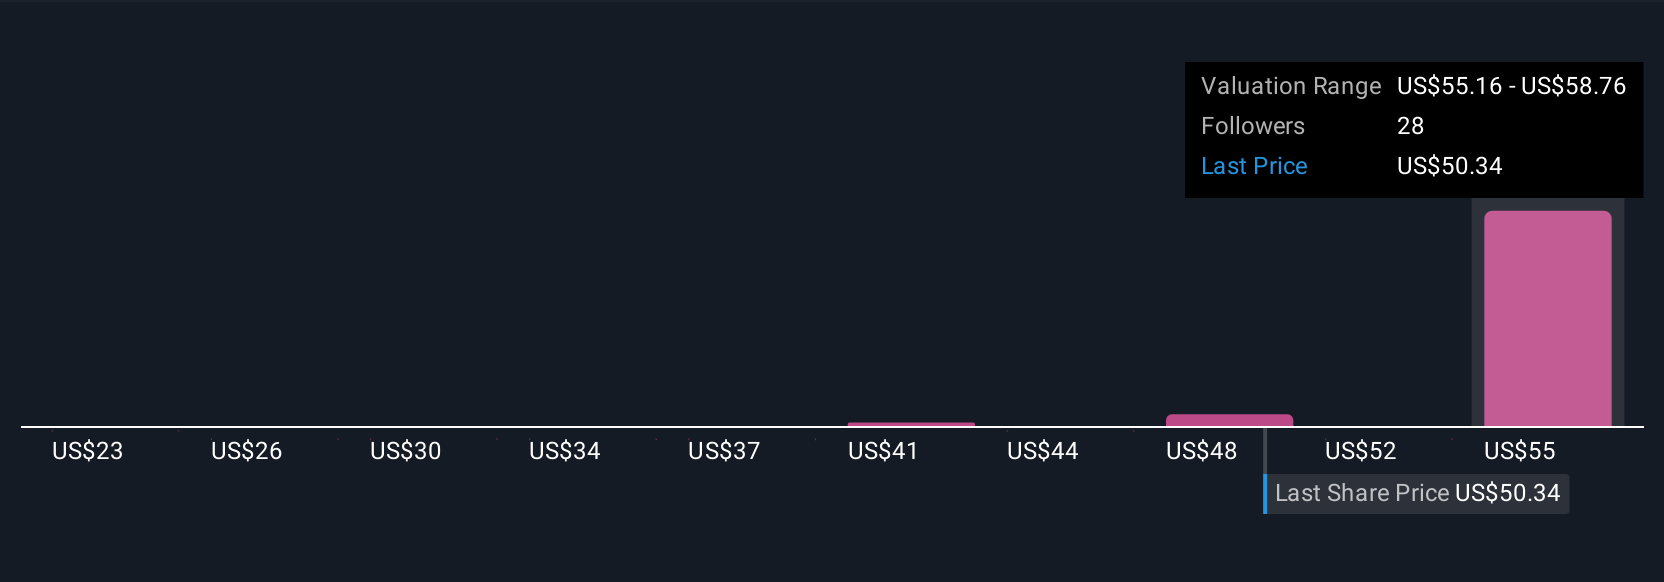
This approach makes deciding when to buy or sell much clearer. Narratives show you your Fair Value alongside the current Price, so you can react with confidence as your thesis evolves. For example, while one Narrative for Flex may focus on rapid AI-driven revenue growth and support a Fair Value near $75, another may highlight thin margins and client risks to suggest a value closer to $50. This shows how two investors, both using the same numbers, can reach different conclusions based on their perspective.
Do you think there's more to the story for Flex? Head over to our Community to see what others are saying!
This article by Simply Wall St is general in nature. We provide commentary based on historical data and analyst forecasts only using an unbiased methodology and our articles are not intended to be financial advice. It does not constitute a recommendation to buy or sell any stock, and does not take account of your objectives, or your financial situation. We aim to bring you long-term focused analysis driven by fundamental data. Note that our analysis may not factor in the latest price-sensitive company announcements or qualitative material. Simply Wall St has no position in any stocks mentioned.
New: AI Stock Screener & Alerts
Our new AI Stock Screener scans the market every day to uncover opportunities.
• Dividend Powerhouses (3%+ Yield)
• Undervalued Small Caps with Insider Buying
• High growth Tech and AI Companies
Or build your own from over 50 metrics.
Have feedback on this article? Concerned about the content? Get in touch with us directly. Alternatively, email editorial-team@simplywallst.com
MI

The Foxhole
Is Nvidia actually expensive at 32 times earnings? I think that number can melt faster than people realise.
1410
MA
marcus_l38oa
Why would I fret over Nvidia results now? I think it's moment has gone. I will invert and see what companies can be the next Nvidia.
SE
sean_3pk06
Multiple has already melted 50 percent in the last year. It can melt another 50 percent from here in the next year?
 Mitchell Lawler
Market Insights
Which payment stocks actually get paid?

Every new payment app was supposed to kill Visa and Mastercard. Instead, they got bigger. So what does that mean for the payment stocks on your radar?
42
About NasdaqGS:FLEX
Flex
Provides technology innovation, supply chain, and manufacturing solutions to data center, communications, enterprise, consumer, automotive, healthcare, industrial, and power industries in the Americas, Asia, and Europe.
Exceptional growth potential with excellent balance sheet.
Similar Companies
Market Insights


Advertisement
Weekly Picks
RI


Rick_Orford on Starfighters Space ·
The 1960s Fighter Jet That Could Crack Open a $20 Billion Satellite Market
Fair Value:US$522.6% undervalued
71 followersusers have followed this narrative
4 commentsusers have commented on this narrative
11 likesusers have liked this narrative
TR


tripledub on Meta Platforms ·
The $135 Billion Bet That Should Make Every Shareholder Nervous
Fair Value:US$5861.7% undervalued
56 followersusers have followed this narrative
3 commentsusers have commented on this narrative
34 likesusers have liked this narrative
TA


Talos on Voyager Technologies ·
The "Landlord of Orbit" – A Deep Value Play Ahead of the Starlab Era
Fair Value:US$385.291.0% undervalued
49 followersusers have followed this narrative
0 commentsusers have commented on this narrative
5 likesusers have liked this narrative
IV

Ivoed on Uber Technologies ·
Uber’s Valuation Depends On Who Captures The Economics Of Driverless Rides
Fair Value:US$11632.3% undervalued
12 followersusers have followed this narrative
0 commentsusers have commented on this narrative
3 likesusers have liked this narrative
Recently Updated Narratives
JO


John_Eric on Veeva Systems ·
AI-Powered Veeva Systems Poised for Solid Growth Amid Regulatory Stability
Fair Value:US$383.1436.1% undervalued
45 followersusers have followed this narrative
0 commentsusers have commented on this narrative
0 likesusers have liked this narrative
LU


LunaRodas on NVIDIA ·
NVDA | Nvidia Corporation: What They Said vs. What They Did
Fair Value:US$315.0333.4% undervalued
1 followerusers have followed this narrative
0 commentsusers have commented on this narrative
0 likesusers have liked this narrative
IN

InvestingNurse on Lexaria Bioscience ·
Lexaria Bioscience's Breakthrough with DehydraTECH to Revolutionize Drug Delivery
Fair Value:US$2352.0% undervalued
3 followersusers have followed this narrative
0 commentsusers have commented on this narrative
0 likesusers have liked this narrative
Popular Narratives
OS

oscargarcia on NVIDIA ·
The company that went from selling GPUs to gamers to becoming the AI arms dealer of the 21st century.
Fair Value:US$28025.1% undervalued
359 followersusers have followed this narrative
9 commentsusers have commented on this narrative
16 likesusers have liked this narrative
CU

CubanEros on Microsoft ·
A wonderful business at reasonable price.
Fair Value:US$419.9118.2% overvalued
207 followersusers have followed this narrative
0 commentsusers have commented on this narrative
9 likesusers have liked this narrative
KI

KiwiInvest on Amazon.com ·
Amazon's high growth, high tech segments propel its profits, while traditional segments plod along
Fair Value:US$475.0945.2% undervalued
231 followersusers have followed this narrative
1 commentusers have commented on this narrative
8 likesusers have liked this narrative


