
Advertisement
- United States
- /
- Communications
- /
- NasdaqGM:CLFD
What Clearfield, Inc.'s (NASDAQ:CLFD) 25% Share Price Gain Is Not Telling You
The Clearfield, Inc. (NASDAQ:CLFD) share price has done very well over the last month, posting an excellent gain of 25%. But the gains over the last month weren't enough to make shareholders whole, as the share price is still down 2.4% in the last twelve months.
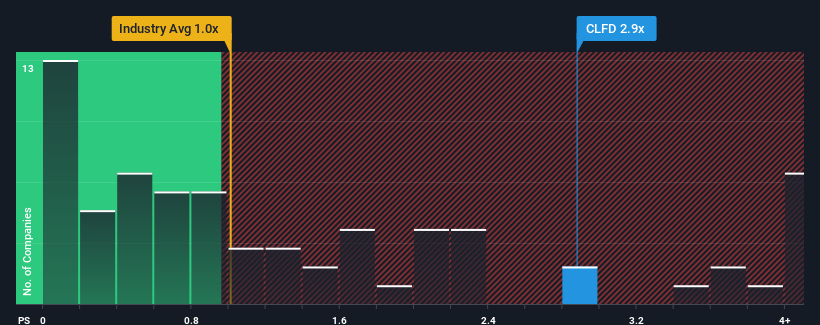
Following the firm bounce in price, you could be forgiven for thinking Clearfield is a stock not worth researching with a price-to-sales ratios (or "P/S") of 2.9x, considering almost half the companies in the United States' Communications industry have P/S ratios below 1x. Although, it's not wise to just take the P/S at face value as there may be an explanation why it's as high as it is.
See our latest analysis for Clearfield
What Does Clearfield's Recent Performance Look Like?
Clearfield could be doing better as its revenue has been going backwards lately while most other companies have been seeing positive revenue growth. It might be that many expect the dour revenue performance to recover substantially, which has kept the P/S from collapsing. If not, then existing shareholders may be extremely nervous about the viability of the share price.
Want the full picture on analyst estimates for the company? Then our free report on Clearfield will help you uncover what's on the horizon.How Is Clearfield's Revenue Growth Trending?
In order to justify its P/S ratio, Clearfield would need to produce impressive growth in excess of the industry.
Retrospectively, the last year delivered a frustrating 44% decrease to the company's top line. Still, the latest three year period has seen an excellent 65% overall rise in revenue, in spite of its unsatisfying short-term performance. Although it's been a bumpy ride, it's still fair to say the revenue growth recently has been more than adequate for the company.
Turning to the outlook, the next year should bring diminished returns, with revenue decreasing 3.2% as estimated by the four analysts watching the company. With the industry predicted to deliver 4.1% growth, that's a disappointing outcome.
With this in mind, we find it intriguing that Clearfield's P/S is closely matching its industry peers. Apparently many investors in the company reject the analyst cohort's pessimism and aren't willing to let go of their stock at any price. Only the boldest would assume these prices are sustainable as these declining revenues are likely to weigh heavily on the share price eventually.
What Does Clearfield's P/S Mean For Investors?
Clearfield's P/S is on the rise since its shares have risen strongly. We'd say the price-to-sales ratio's power isn't primarily as a valuation instrument but rather to gauge current investor sentiment and future expectations.
We've established that Clearfield currently trades on a much higher than expected P/S for a company whose revenues are forecast to decline. In cases like this where we see revenue decline on the horizon, we suspect the share price is at risk of following suit, bringing back the high P/S into the realms of suitability. Unless these conditions improve markedly, it'll be a challenging time for shareholders.
There are also other vital risk factors to consider before investing and we've discovered 1 warning sign for Clearfield that you should be aware of.
If you're unsure about the strength of Clearfield's business, why not explore our interactive list of stocks with solid business fundamentals for some other companies you may have missed.
New: AI Stock Screener & Alerts
Our new AI Stock Screener scans the market every day to uncover opportunities.
• Dividend Powerhouses (3%+ Yield)
• Undervalued Small Caps with Insider Buying
• High growth Tech and AI Companies
Or build your own from over 50 metrics.
Have feedback on this article? Concerned about the content? Get in touch with us directly. Alternatively, email editorial-team (at) simplywallst.com.
This article by Simply Wall St is general in nature. We provide commentary based on historical data and analyst forecasts only using an unbiased methodology and our articles are not intended to be financial advice. It does not constitute a recommendation to buy or sell any stock, and does not take account of your objectives, or your financial situation. We aim to bring you long-term focused analysis driven by fundamental data. Note that our analysis may not factor in the latest price-sensitive company announcements or qualitative material. Simply Wall St has no position in any stocks mentioned.
About NasdaqGM:CLFD
Clearfield
Designs, manufactures, and distributes fiber management, protection, and delivery products in the United States and internationally.
Flawless balance sheet with reasonable growth potential.
Similar Companies
Market Insights

Advertisement
Weekly Picks
FA

FAI on Arabian Internet and Communication Services ·
Solutions by stc: 34% Upside in Saudi's Digital Transformation Leader
Fair Value:ر.س342.2335.7% undervalued
10 followersusers have followed this narrative
1 commentusers have commented on this narrative
4 likesusers have liked this narrative
RO


RobertoAllende on NVIDIA ·
The AI Infrastructure Giant Grows Into Its Valuation
Fair Value:US$345.0747.9% undervalued
27 followersusers have followed this narrative
28 commentsusers have commented on this narrative
21 likesusers have liked this narrative
Recently Updated Narratives
TA


Talos on PayPal Holdings ·
The "Sleeping Giant" Wakes Up – Efficiency & Monetization
Fair Value:US$174.9264.2% undervalued
3 followersusers have followed this narrative
0 commentsusers have commented on this narrative
0 likesusers have liked this narrative
TA

Talos on Pagaya Technologies ·
The "Rate Cut" Supercycle Winner – Profitable & Accelerating
Fair Value:US$170.685.9% undervalued
1 followerusers have followed this narrative
1 commentusers have commented on this narrative
0 likesusers have liked this narrative
TA

Talos on Archer Aviation ·
The Industrialist of the Skies – Scaling with "Automotive DNA
Fair Value:US$16.3254.3% undervalued
1 followerusers have followed this narrative
0 commentsusers have commented on this narrative
0 likesusers have liked this narrative
Popular Narratives
TH


TheWallstreetKing on MicroVision ·
MicroVision will explode future revenue by 380.37% with a vision towards success
Fair Value:US$6098.6% undervalued
111 followersusers have followed this narrative
11 commentsusers have commented on this narrative
22 likesusers have liked this narrative
AN

AnalystConsensusTarget on NVIDIA ·
NVDA: Expanding AI Demand Will Drive Major Data Center Investments Through 2026
Fair Value:US$250.3928.1% undervalued
945 followersusers have followed this narrative
6 commentsusers have commented on this narrative
24 likesusers have liked this narrative
OS


oscargarcia on Alphabet ·
The company that turned a verb into a global necessity and basically runs the modern internet, digital ads, smartphones, maps, and AI.
Fair Value:US$3407.4% undervalued
146 followersusers have followed this narrative
6 commentsusers have commented on this narrative
18 likesusers have liked this narrative