
Advertisement
- United States
- /
- Communications
- /
- NasdaqGM:AAOI
After Leaping 38% Applied Optoelectronics, Inc. (NASDAQ:AAOI) Shares Are Not Flying Under The Radar
Applied Optoelectronics, Inc. (NASDAQ:AAOI) shareholders are no doubt pleased to see that the share price has bounced 38% in the last month, although it is still struggling to make up recently lost ground. The last 30 days bring the annual gain to a very sharp 40%.
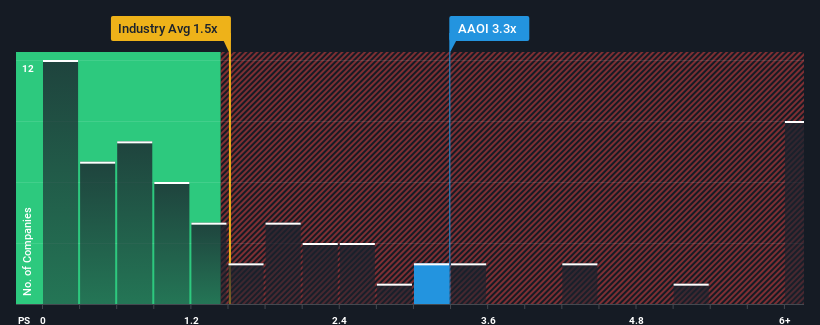
Since its price has surged higher, when almost half of the companies in the United States' Communications industry have price-to-sales ratios (or "P/S") below 1.5x, you may consider Applied Optoelectronics as a stock probably not worth researching with its 3.3x P/S ratio. Nonetheless, we'd need to dig a little deeper to determine if there is a rational basis for the elevated P/S.
Our free stock report includes 2 warning signs investors should be aware of before investing in Applied Optoelectronics. Read for free now.View our latest analysis for Applied Optoelectronics
How Applied Optoelectronics Has Been Performing
With revenue growth that's superior to most other companies of late, Applied Optoelectronics has been doing relatively well. The P/S is probably high because investors think this strong revenue performance will continue. You'd really hope so, otherwise you're paying a pretty hefty price for no particular reason.
Keen to find out how analysts think Applied Optoelectronics' future stacks up against the industry? In that case, our free report is a great place to start.How Is Applied Optoelectronics' Revenue Growth Trending?
Applied Optoelectronics' P/S ratio would be typical for a company that's expected to deliver solid growth, and importantly, perform better than the industry.
Retrospectively, the last year delivered a decent 15% gain to the company's revenues. The latest three year period has also seen a 18% overall rise in revenue, aided somewhat by its short-term performance. Therefore, it's fair to say the revenue growth recently has been respectable for the company.
Turning to the outlook, the next year should generate growth of 113% as estimated by the five analysts watching the company. With the industry only predicted to deliver 9.6%, the company is positioned for a stronger revenue result.
With this information, we can see why Applied Optoelectronics is trading at such a high P/S compared to the industry. It seems most investors are expecting this strong future growth and are willing to pay more for the stock.
The Key Takeaway
Applied Optoelectronics shares have taken a big step in a northerly direction, but its P/S is elevated as a result. Generally, our preference is to limit the use of the price-to-sales ratio to establishing what the market thinks about the overall health of a company.
As we suspected, our examination of Applied Optoelectronics' analyst forecasts revealed that its superior revenue outlook is contributing to its high P/S. At this stage investors feel the potential for a deterioration in revenues is quite remote, justifying the elevated P/S ratio. Unless the analysts have really missed the mark, these strong revenue forecasts should keep the share price buoyant.
We don't want to rain on the parade too much, but we did also find 2 warning signs for Applied Optoelectronics that you need to be mindful of.
If you're unsure about the strength of Applied Optoelectronics' business, why not explore our interactive list of stocks with solid business fundamentals for some other companies you may have missed.
New: Manage All Your Stock Portfolios in One Place
We've created the ultimate portfolio companion for stock investors, and it's free.
• Connect an unlimited number of Portfolios and see your total in one currency
• Be alerted to new Warning Signs or Risks via email or mobile
• Track the Fair Value of your stocks
Have feedback on this article? Concerned about the content? Get in touch with us directly. Alternatively, email editorial-team (at) simplywallst.com.
This article by Simply Wall St is general in nature. We provide commentary based on historical data and analyst forecasts only using an unbiased methodology and our articles are not intended to be financial advice. It does not constitute a recommendation to buy or sell any stock, and does not take account of your objectives, or your financial situation. We aim to bring you long-term focused analysis driven by fundamental data. Note that our analysis may not factor in the latest price-sensitive company announcements or qualitative material. Simply Wall St has no position in any stocks mentioned.
About NasdaqGM:AAOI
Applied Optoelectronics
Designs, manufactures, and sells fiber-optic networking products in the United States, Taiwan, and China.
Flawless balance sheet with high growth potential.
Similar Companies
Market Insights

Advertisement
Weekly Picks
RO


RockeTeller on Santacruz Silver Mining ·
Crazy Undervalued 42 Baggers Silver Play (Active & Running Mine)
Fair Value:CA$8696.7% undervalued
43 followersusers have followed this narrative
6 commentsusers have commented on this narrative
15 likesusers have liked this narrative
RO


Robbo on Fiducian Group ·
Fiducian: Compliance Clouds or Value Opportunity?
Fair Value:AU$123.8% undervalued
6 followersusers have followed this narrative
0 commentsusers have commented on this narrative
0 likesusers have liked this narrative
WO

woodworthfund on Willamette Valley Vineyards ·
Willamette Valley Vineyards (WVVI): Not-So-Great Value
Fair Value:US$247.5% overvalued
8 followersusers have followed this narrative
0 commentsusers have commented on this narrative
1 likeusers have liked this narrative
Recently Updated Narratives
SC

scm on Text ·
TXT will see revenue grow 26% with a profit margin boost of almost 40%
Fair Value:zł8049.8% undervalued
3 followersusers have followed this narrative
0 commentsusers have commented on this narrative
0 likesusers have liked this narrative
VL

Vladislav on Galleon Gold ·
Significantly undervalued gold explorer in Timmins, finally getting traction
Fair Value:CA$482.8% undervalued
3 followersusers have followed this narrative
0 commentsusers have commented on this narrative
0 likesusers have liked this narrative
FU

FundamentallySarcastic on Credit Corp Group ·
Moderation and Stabilisation: HOLD: Fair Price based on a 4-year Cycle is $12.08
Fair Value:AU$12.6411.8% overvalued
3 followersusers have followed this narrative
0 commentsusers have commented on this narrative
0 likesusers have liked this narrative
Popular Narratives
TH


TheWallstreetKing on MicroVision ·
MicroVision will explode future revenue by 380.37% with a vision towards success
Fair Value:US$6098.5% undervalued
116 followersusers have followed this narrative
11 commentsusers have commented on this narrative
22 likesusers have liked this narrative
AN


AnalystConsensusTarget on NVIDIA ·
NVDA: Expanding AI Demand Will Drive Major Data Center Investments Through 2026
Fair Value:US$250.3926.7% undervalued
955 followersusers have followed this narrative
6 commentsusers have commented on this narrative
25 likesusers have liked this narrative
OS


oscargarcia on Alphabet ·
The company that turned a verb into a global necessity and basically runs the modern internet, digital ads, smartphones, maps, and AI.
Fair Value:US$3406.6% undervalued
147 followersusers have followed this narrative
6 commentsusers have commented on this narrative
18 likesusers have liked this narrative

