Advertisement
- United States
- /
- Software
- /
- NYSE:WK
Is Now the Right Moment for Workiva After Its Recent 10% Rally?

Simply Wall St
Reviewed by Bailey Pemberton
Thinking about what to do with Workiva stock? You are not alone. Over the past month, this cloud-based compliance and reporting platform has seen its shares edge up nearly 10%, a solid rebound after a tough start to the year. The stock is still down more than 19% year to date, but if you widen the lens, Workiva has delivered impressive 3-year and 5-year returns of 20.2% and 45.1% respectively. That kind of long-term performance keeps investors watching closely, especially as cloud and data security solutions stay central to business needs.
Recent enthusiasm in the market for data-driven compliance tools has certainly helped sentiment, with investors showing renewed confidence in digital platforms that help companies keep pace with evolving regulations. As a result, there is a fresh debate brewing about whether Workiva is undervalued right now, especially considering its valuation score of 3 out of 6, which means it checks the box for undervaluation with half the major industry metrics.
So, what does that actually mean? In the next section, we will break down those valuation metrics one at a time and see where Workiva stands against its peers. And stick around, because beyond the traditional numbers, we will explore a perspective on valuation that most investors overlook.
Why Workiva is lagging behind its peers
Approach 1: Workiva Discounted Cash Flow (DCF) Analysis
The Discounted Cash Flow (DCF) model estimates a company’s intrinsic value by projecting its future cash flows and then discounting those amounts back to today’s dollars. This method gives investors a clearer sense of what the business might be worth if its growth and profits continue as predicted.
For Workiva, the DCF model uses a 2 Stage Free Cash Flow to Equity approach. Currently, Workiva’s latest twelve months Free Cash Flow stands at $102.7 Million. Analyst forecasts suggest steady growth with estimates projecting Free Cash Flow reaching $297.7 Million by 2029. These projections are generally robust for the first five years, benefitting from analyst coverage; future years beyond are extrapolated to account for ongoing momentum.
Based on these forward-looking calculations, the DCF analysis derives an estimated fair value of $105.76 per share. With shares presently trading at a price implying a 17.0% discount to this value, the stock appears undervalued according to this model.
Result: UNDERVALUED
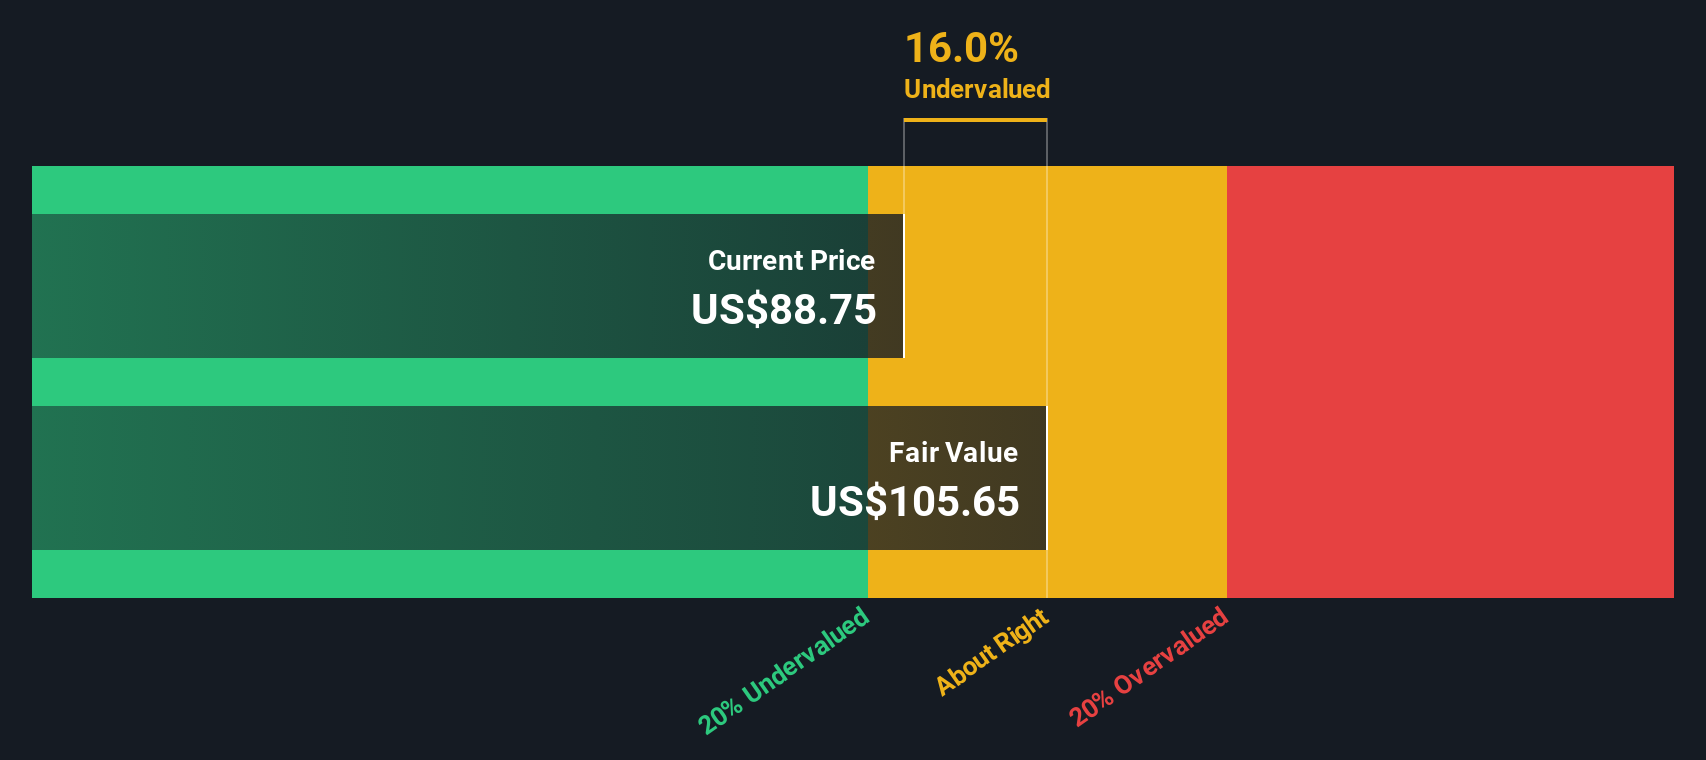
Our Discounted Cash Flow (DCF) analysis suggests Workiva is undervalued by 17.0%. Track this in your watchlist or portfolio, or discover more undervalued stocks.
Approach 2: Workiva Price vs Sales
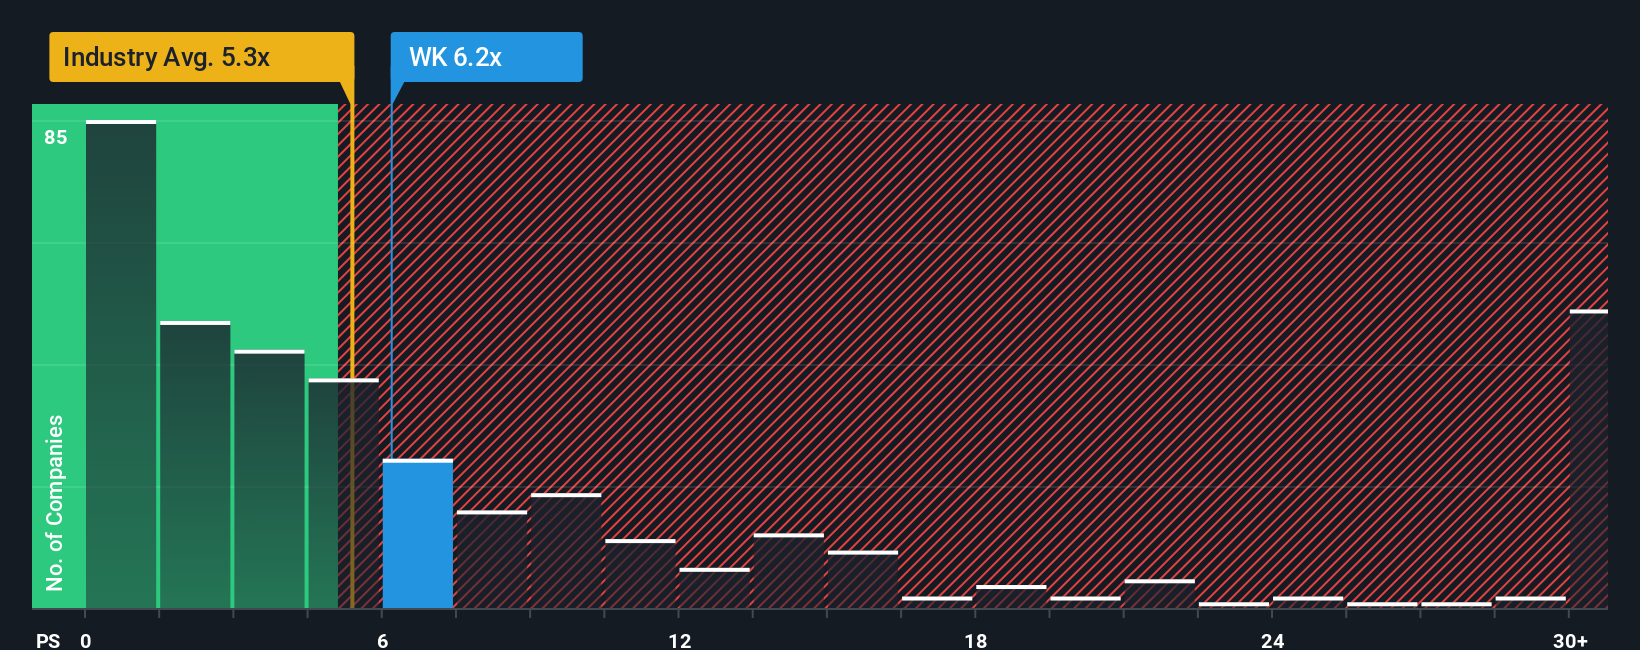
When evaluating growth-focused software companies like Workiva, the Price-to-Sales (P/S) multiple is often the go-to valuation tool. This is especially true for firms that are reinvesting aggressively into growth and may not yet be posting steady profits. The P/S ratio lets investors compare revenue against market capitalization, providing insight into how much the market values each dollar of sales.
Growth expectations and risk profile influence what is considered a “normal” P/S ratio. Higher growth outlooks generally justify a higher multiple, while greater risks or weaker profit margins push it lower. For Workiva, the current P/S ratio sits at 6.09x. This is slightly above the industry average of 5.29x but below the peer average of 7.73x within the Software sector.
Simply Wall St’s Fair Ratio takes this further by factoring in Workiva’s unique earnings growth, profit margins, risk, industry positioning and market size. This comprehensive approach avoids the trap of simple peer comparisons by adjusting for nuances in each business and the market environment, producing a fairer and more tailored valuation benchmark.
With a Fair Ratio of 6.91x and Workiva’s actual multiple at 6.09x, the stock trades a bit below where it would be expected given its profile. This suggests Workiva is undervalued based on this preferred multiple approach.
Result: UNDERVALUED
PS ratios tell one story, but what if the real opportunity lies elsewhere? Discover companies where insiders are betting big on explosive growth.
Upgrade Your Decision Making: Choose your Workiva Narrative
Earlier we mentioned there is an even better way to understand valuation, so let's introduce you to Narratives. A Narrative is simply your story about a company, combining your assumptions about future revenue, earnings, and margins into a cohesive outlook that connects the company’s journey with tangible financial forecasts and an estimated fair value.
Rather than relying on rigid ratios or historic averages, Narratives empower you to shape your own perspective. This approach brings numbers to life with context about market opportunities, risks, and company strategy. On Simply Wall St’s Community page, millions of investors use this tool for Workiva and other companies, updating Narratives as new earnings or news emerge to ensure their investment thesis stays relevant and dynamic.
By crafting or following a Narrative, you can easily see at a glance whether your fair value estimate suggests a buy, hold, or sell compared to the latest share price. You can also track how your view shifts as new information comes in. For example, in the Workiva community, some investors are optimistic, seeing multi-solution platforms and global expansion driving a fair value as high as $105. Others are more cautious, valuing the company at just $85 depending on how they weigh growth risks and market conditions.
Do you think there's more to the story for Workiva? Create your own Narrative to let the Community know!
This article by Simply Wall St is general in nature. We provide commentary based on historical data and analyst forecasts only using an unbiased methodology and our articles are not intended to be financial advice. It does not constitute a recommendation to buy or sell any stock, and does not take account of your objectives, or your financial situation. We aim to bring you long-term focused analysis driven by fundamental data. Note that our analysis may not factor in the latest price-sensitive company announcements or qualitative material. Simply Wall St has no position in any stocks mentioned.
Valuation is complex, but we're here to simplify it.
Discover if Workiva might be undervalued or overvalued with our detailed analysis, featuring fair value estimates, potential risks, dividends, insider trades, and its financial condition.
Access Free AnalysisHave feedback on this article? Concerned about the content? Get in touch with us directly. Alternatively, email editorial-team@simplywallst.com
About NYSE:WK
Workiva
Provides cloud-based reporting solutions in the Americas and internationally.
High growth potential and fair value.
Similar Companies
Market Insights

Advertisement
Community Narratives
The Next Phase of Energy Storage: How NeoVolta Is Tackling America’s Power Crunch
Fair Value US$7.50|35.1% undervalued
MA
Community Contributor
Why EnSilica is Worth Possibly 13x its Current Price
Fair Value UK£5.00|89.8% undervalued
DO
Community Contributor
M&A Activity, Industry Diversification & A Defense Contract Monopoly Will Push BWXT For Healthy Long-Term Growth
Fair Value US$220.00|15.2% undervalued
CL
Community Contributor
A case for Cassiar Gold Corp (TSXV: GLDC) to reach CAD$8-10 before 2030 (X30-37)
Fair Value CA$10.00|96.0% undervalued
AG
Community Contributor