

If you're not sure where to start when looking for the next multi-bagger, there are a few key trends you should keep an eye out for. Typically, we'll want to notice a trend of growing return on capital employed (ROCE) and alongside that, an expanding base of capital employed. This shows us that it's a compounding machine, able to continually reinvest its earnings back into the business and generate higher returns. So when we looked at Teradata (NYSE:TDC), they do have a high ROCE, but we weren't exactly elated from how returns are trending.
Return On Capital Employed (ROCE): What is it?
For those who don't know, ROCE is a measure of a company's yearly pre-tax profit (its return), relative to the capital employed in the business. Analysts use this formula to calculate it for Teradata:
Return on Capital Employed = Earnings Before Interest and Tax (EBIT) ÷ (Total Assets - Current Liabilities)
0.21 = US$240m ÷ (US$2.2b - US$1.0b) (Based on the trailing twelve months to December 2021).
So, Teradata has an ROCE of 21%. That's a fantastic return and not only that, it outpaces the average of 9.2% earned by companies in a similar industry.
View our latest analysis for Teradata
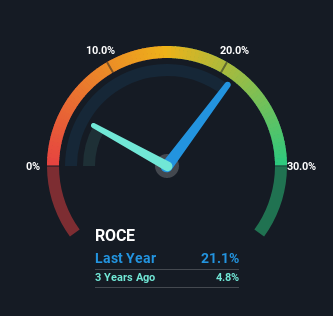
In the above chart we have measured Teradata's prior ROCE against its prior performance, but the future is arguably more important. If you'd like to see what analysts are forecasting going forward, you should check out our free report for Teradata.
What Can We Tell From Teradata's ROCE Trend?
We've noticed that although returns on capital are flat over the last five years, the amount of capital employed in the business has fallen 33% in that same period. To us that doesn't look like a multi-bagger because the company appears to be selling assets and it's returns aren't increasing. But we have to give it to Teradata because the returns on the capital it is employing are still high in relative terms.
On another note, while the change in ROCE trend might not scream for attention, it's interesting that the current liabilities have actually gone up over the last five years. This is intriguing because if current liabilities hadn't increased to 48% of total assets, this reported ROCE would probably be less than21% because total capital employed would be higher.The 21% ROCE could be even lower if current liabilities weren't 48% of total assets, because the the formula would show a larger base of total capital employed. So with current liabilities at such high levels, this effectively means the likes of suppliers or short-term creditors are funding a meaningful part of the business, which in some instances can bring some risks.
What We Can Learn From Teradata's ROCE
In summary, Teradata isn't reinvesting funds back into the business and returns aren't growing. Although the market must be expecting these trends to improve because the stock has gained 41% over the last five years. But if the trajectory of these underlying trends continue, we think the likelihood of it being a multi-bagger from here isn't high.
One more thing: We've identified 2 warning signs with Teradata (at least 1 which is a bit unpleasant) , and understanding these would certainly be useful.
High returns are a key ingredient to strong performance, so check out our free list ofstocks earning high returns on equity with solid balance sheets.
If you're looking to trade Teradata, open an account with the lowest-cost platform trusted by professionals, Interactive Brokers.
With clients in over 200 countries and territories, and access to 160 markets, IBKR lets you trade stocks, options, futures, forex, bonds and funds from a single integrated account.
Enjoy no hidden fees, no account minimums, and FX conversion rates as low as 0.03%, far better than what most brokers offer.
Sponsored ContentValuation is complex, but we're here to simplify it.
Discover if Teradata might be undervalued or overvalued with our detailed analysis, featuring fair value estimates, potential risks, dividends, insider trades, and its financial condition.
Access Free AnalysisHave feedback on this article? Concerned about the content? Get in touch with us directly. Alternatively, email editorial-team (at) simplywallst.com.
This article by Simply Wall St is general in nature. We provide commentary based on historical data and analyst forecasts only using an unbiased methodology and our articles are not intended to be financial advice. It does not constitute a recommendation to buy or sell any stock, and does not take account of your objectives, or your financial situation. We aim to bring you long-term focused analysis driven by fundamental data. Note that our analysis may not factor in the latest price-sensitive company announcements or qualitative material. Simply Wall St has no position in any stocks mentioned.
About NYSE:TDC
Teradata
Provides a connected hybrid cloud analytics and data platform in the United States and internationally.
Undervalued with proven track record.
Similar Companies
Market Insights

Community Narratives

