
Advertisement
- United States
- /
- Software
- /
- NYSE:RAMP
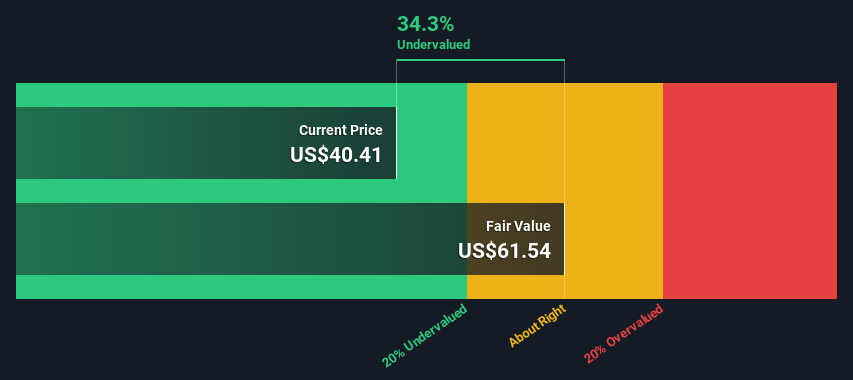
Is There An Opportunity With LiveRamp Holdings, Inc.'s (NYSE:RAMP) 34% Undervaluation?
Key Insights
- Using the 2 Stage Free Cash Flow to Equity, LiveRamp Holdings fair value estimate is US$61.54
- Current share price of US$40.41 suggests LiveRamp Holdings is potentially 34% undervalued
- Analyst price target for RAMP is US$43.78 which is 29% below our fair value estimate
In this article we are going to estimate the intrinsic value of LiveRamp Holdings, Inc. (NYSE:RAMP) by taking the expected future cash flows and discounting them to their present value. This will be done using the Discounted Cash Flow (DCF) model. It may sound complicated, but actually it is quite simple!
We would caution that there are many ways of valuing a company and, like the DCF, each technique has advantages and disadvantages in certain scenarios. If you want to learn more about discounted cash flow, the rationale behind this calculation can be read in detail in the Simply Wall St analysis model.
Check out our latest analysis for LiveRamp Holdings
Crunching The Numbers
We're using the 2-stage growth model, which simply means we take in account two stages of company's growth. In the initial period the company may have a higher growth rate and the second stage is usually assumed to have a stable growth rate. To start off with, we need to estimate the next ten years of cash flows. Where possible we use analyst estimates, but when these aren't available we extrapolate the previous free cash flow (FCF) from the last estimate or reported value. We assume companies with shrinking free cash flow will slow their rate of shrinkage, and that companies with growing free cash flow will see their growth rate slow, over this period. We do this to reflect that growth tends to slow more in the early years than it does in later years.
A DCF is all about the idea that a dollar in the future is less valuable than a dollar today, so we need to discount the sum of these future cash flows to arrive at a present value estimate:
10-year free cash flow (FCF) estimate
| 2024 | 2025 | 2026 | 2027 | 2028 | 2029 | 2030 | 2031 | 2032 | 2033 | |
| Levered FCF ($, Millions) | US$105.5m | US$114.3m | US$138.8m | US$163.8m | US$192.4m | US$213.5m | US$231.4m | US$246.5m | US$259.4m | US$270.6m |
| Growth Rate Estimate Source | Analyst x2 | Analyst x1 | Analyst x1 | Analyst x1 | Analyst x1 | Est @ 10.99% | Est @ 8.36% | Est @ 6.52% | Est @ 5.23% | Est @ 4.33% |
| Present Value ($, Millions) Discounted @ 7.2% | US$98.4 | US$99.5 | US$113 | US$124 | US$136 | US$141 | US$142 | US$141 | US$139 | US$135 |
("Est" = FCF growth rate estimated by Simply Wall St)
Present Value of 10-year Cash Flow (PVCF) = US$1.3b
We now need to calculate the Terminal Value, which accounts for all the future cash flows after this ten year period. The Gordon Growth formula is used to calculate Terminal Value at a future annual growth rate equal to the 5-year average of the 10-year government bond yield of 2.2%. We discount the terminal cash flows to today's value at a cost of equity of 7.2%.
Terminal Value (TV)= FCF2033 × (1 + g) ÷ (r – g) = US$271m× (1 + 2.2%) ÷ (7.2%– 2.2%) = US$5.5b
Present Value of Terminal Value (PVTV)= TV / (1 + r)10= US$5.5b÷ ( 1 + 7.2%)10= US$2.8b
The total value is the sum of cash flows for the next ten years plus the discounted terminal value, which results in the Total Equity Value, which in this case is US$4.0b. In the final step we divide the equity value by the number of shares outstanding. Relative to the current share price of US$40.4, the company appears quite good value at a 34% discount to where the stock price trades currently. Valuations are imprecise instruments though, rather like a telescope - move a few degrees and end up in a different galaxy. Do keep this in mind.
Important Assumptions
Now the most important inputs to a discounted cash flow are the discount rate, and of course, the actual cash flows. Part of investing is coming up with your own evaluation of a company's future performance, so try the calculation yourself and check your own assumptions. The DCF also does not consider the possible cyclicality of an industry, or a company's future capital requirements, so it does not give a full picture of a company's potential performance. Given that we are looking at LiveRamp Holdings as potential shareholders, the cost of equity is used as the discount rate, rather than the cost of capital (or weighted average cost of capital, WACC) which accounts for debt. In this calculation we've used 7.2%, which is based on a levered beta of 0.997. Beta is a measure of a stock's volatility, compared to the market as a whole. We get our beta from the industry average beta of globally comparable companies, with an imposed limit between 0.8 and 2.0, which is a reasonable range for a stable business.
Next Steps:
Although the valuation of a company is important, it ideally won't be the sole piece of analysis you scrutinize for a company. DCF models are not the be-all and end-all of investment valuation. Rather it should be seen as a guide to "what assumptions need to be true for this stock to be under/overvalued?" For instance, if the terminal value growth rate is adjusted slightly, it can dramatically alter the overall result. Can we work out why the company is trading at a discount to intrinsic value? For LiveRamp Holdings, we've put together three important elements you should explore:
- Risks: As an example, we've found 1 warning sign for LiveRamp Holdings that you need to consider before investing here.
- Management:Have insiders been ramping up their shares to take advantage of the market's sentiment for RAMP's future outlook? Check out our management and board analysis with insights on CEO compensation and governance factors.
- Other Solid Businesses: Low debt, high returns on equity and good past performance are fundamental to a strong business. Why not explore our interactive list of stocks with solid business fundamentals to see if there are other companies you may not have considered!
PS. The Simply Wall St app conducts a discounted cash flow valuation for every stock on the NYSE every day. If you want to find the calculation for other stocks just search here.
New: AI Stock Screener & Alerts
Our new AI Stock Screener scans the market every day to uncover opportunities.
• Dividend Powerhouses (3%+ Yield)
• Undervalued Small Caps with Insider Buying
• High growth Tech and AI Companies
Or build your own from over 50 metrics.
Have feedback on this article? Concerned about the content? Get in touch with us directly. Alternatively, email editorial-team (at) simplywallst.com.
This article by Simply Wall St is general in nature. We provide commentary based on historical data and analyst forecasts only using an unbiased methodology and our articles are not intended to be financial advice. It does not constitute a recommendation to buy or sell any stock, and does not take account of your objectives, or your financial situation. We aim to bring you long-term focused analysis driven by fundamental data. Note that our analysis may not factor in the latest price-sensitive company announcements or qualitative material. Simply Wall St has no position in any stocks mentioned.
About NYSE:RAMP
LiveRamp Holdings
A technology company, operates a data collaboration platform in the United States, Europe, the Asia-Pacific, and internationally.
Flawless balance sheet with solid track record.
Similar Companies
Market Insights

Advertisement
Community Narratives
MicroVision will explode future revenue by 380.37% with a vision towards success
Fair Value US$60.00|98.5% undervalued
TH
Community Contributor
The Indispensable Artery for a New North American Economy
Fair Value CA$132.87|2.3% undervalued
TI
Community Contributor