- United States
- /
- Software
- /
- NYSE:OLO
Does This Valuation Of Olo Inc. (NYSE:OLO) Imply Investors Are Overpaying?


Key Insights
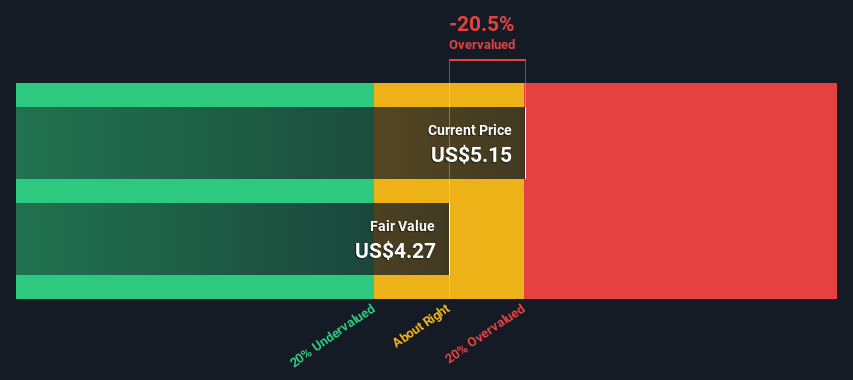
- Using the 2 Stage Free Cash Flow to Equity, Olo fair value estimate is US$4.27
- Olo's US$5.15 share price signals that it might be 21% overvalued
- Analyst price target for OLO is US$8.50, which is 99% above our fair value estimate
In this article we are going to estimate the intrinsic value of Olo Inc. (NYSE:OLO) by taking the expected future cash flows and discounting them to today's value. The Discounted Cash Flow (DCF) model is the tool we will apply to do this. There's really not all that much to it, even though it might appear quite complex.
We would caution that there are many ways of valuing a company and, like the DCF, each technique has advantages and disadvantages in certain scenarios. If you want to learn more about discounted cash flow, the rationale behind this calculation can be read in detail in the Simply Wall St analysis model.
Check out our latest analysis for Olo
Step By Step Through The Calculation
We use what is known as a 2-stage model, which simply means we have two different periods of growth rates for the company's cash flows. Generally the first stage is higher growth, and the second stage is a lower growth phase. To begin with, we have to get estimates of the next ten years of cash flows. Where possible we use analyst estimates, but when these aren't available we extrapolate the previous free cash flow (FCF) from the last estimate or reported value. We assume companies with shrinking free cash flow will slow their rate of shrinkage, and that companies with growing free cash flow will see their growth rate slow, over this period. We do this to reflect that growth tends to slow more in the early years than it does in later years.
A DCF is all about the idea that a dollar in the future is less valuable than a dollar today, so we need to discount the sum of these future cash flows to arrive at a present value estimate:
10-year free cash flow (FCF) estimate
| 2024 | 2025 | 2026 | 2027 | 2028 | 2029 | 2030 | 2031 | 2032 | 2033 | |
| Levered FCF ($, Millions) | US$5.43m | US$11.3m | US$16.5m | US$21.9m | US$27.1m | US$31.8m | US$35.9m | US$39.3m | US$42.2m | US$44.7m |
| Growth Rate Estimate Source | Analyst x3 | Analyst x3 | Est @ 45.92% | Est @ 32.83% | Est @ 23.67% | Est @ 17.25% | Est @ 12.77% | Est @ 9.62% | Est @ 7.42% | Est @ 5.88% |
| Present Value ($, Millions) Discounted @ 6.9% | US$5.1 | US$9.9 | US$13.5 | US$16.8 | US$19.5 | US$21.3 | US$22.5 | US$23.1 | US$23.2 | US$23.0 |
("Est" = FCF growth rate estimated by Simply Wall St)
Present Value of 10-year Cash Flow (PVCF) = US$178m
The second stage is also known as Terminal Value, this is the business's cash flow after the first stage. The Gordon Growth formula is used to calculate Terminal Value at a future annual growth rate equal to the 5-year average of the 10-year government bond yield of 2.3%. We discount the terminal cash flows to today's value at a cost of equity of 6.9%.
Terminal Value (TV)= FCF2033 × (1 + g) ÷ (r – g) = US$45m× (1 + 2.3%) ÷ (6.9%– 2.3%) = US$999m
Present Value of Terminal Value (PVTV)= TV / (1 + r)10= US$999m÷ ( 1 + 6.9%)10= US$514m
The total value, or equity value, is then the sum of the present value of the future cash flows, which in this case is US$692m. In the final step we divide the equity value by the number of shares outstanding. Compared to the current share price of US$5.2, the company appears slightly overvalued at the time of writing. Valuations are imprecise instruments though, rather like a telescope - move a few degrees and end up in a different galaxy. Do keep this in mind.
Important Assumptions
We would point out that the most important inputs to a discounted cash flow are the discount rate and of course the actual cash flows. You don't have to agree with these inputs, I recommend redoing the calculations yourself and playing with them. The DCF also does not consider the possible cyclicality of an industry, or a company's future capital requirements, so it does not give a full picture of a company's potential performance. Given that we are looking at Olo as potential shareholders, the cost of equity is used as the discount rate, rather than the cost of capital (or weighted average cost of capital, WACC) which accounts for debt. In this calculation we've used 6.9%, which is based on a levered beta of 0.995. Beta is a measure of a stock's volatility, compared to the market as a whole. We get our beta from the industry average beta of globally comparable companies, with an imposed limit between 0.8 and 2.0, which is a reasonable range for a stable business.
SWOT Analysis for Olo
- Currently debt free.
- Expensive based on P/S ratio and estimated fair value.
- Forecast to reduce losses next year.
- Has sufficient cash runway for more than 3 years based on current free cash flows.
- Not expected to become profitable over the next 3 years.
Looking Ahead:
Whilst important, the DCF calculation shouldn't be the only metric you look at when researching a company. It's not possible to obtain a foolproof valuation with a DCF model. Rather it should be seen as a guide to "what assumptions need to be true for this stock to be under/overvalued?" For example, changes in the company's cost of equity or the risk free rate can significantly impact the valuation. Can we work out why the company is trading at a premium to intrinsic value? For Olo, there are three pertinent elements you should look at:
- Risks: You should be aware of the 2 warning signs for Olo we've uncovered before considering an investment in the company.
- Management:Have insiders been ramping up their shares to take advantage of the market's sentiment for OLO's future outlook? Check out our management and board analysis with insights on CEO compensation and governance factors.
- Other High Quality Alternatives: Do you like a good all-rounder? Explore our interactive list of high quality stocks to get an idea of what else is out there you may be missing!
PS. Simply Wall St updates its DCF calculation for every American stock every day, so if you want to find the intrinsic value of any other stock just search here.
New: AI Stock Screener & Alerts
Our new AI Stock Screener scans the market every day to uncover opportunities.
• Dividend Powerhouses (3%+ Yield)
• Undervalued Small Caps with Insider Buying
• High growth Tech and AI Companies
Or build your own from over 50 metrics.
Have feedback on this article? Concerned about the content? Get in touch with us directly. Alternatively, email editorial-team (at) simplywallst.com.
This article by Simply Wall St is general in nature. We provide commentary based on historical data and analyst forecasts only using an unbiased methodology and our articles are not intended to be financial advice. It does not constitute a recommendation to buy or sell any stock, and does not take account of your objectives, or your financial situation. We aim to bring you long-term focused analysis driven by fundamental data. Note that our analysis may not factor in the latest price-sensitive company announcements or qualitative material. Simply Wall St has no position in any stocks mentioned.
About NYSE:OLO
Flawless balance sheet low.

