

Today we will run through one way of estimating the intrinsic value of N-able, Inc. (NYSE:NABL) by taking the forecast future cash flows of the company and discounting them back to today's value. The Discounted Cash Flow (DCF) model is the tool we will apply to do this. There's really not all that much to it, even though it might appear quite complex.
We would caution that there are many ways of valuing a company and, like the DCF, each technique has advantages and disadvantages in certain scenarios. If you still have some burning questions about this type of valuation, take a look at the Simply Wall St analysis model.
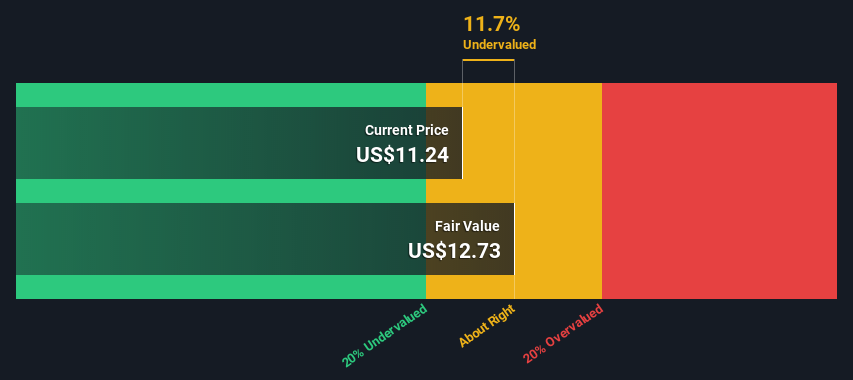
Our analysis indicates that NABL is potentially undervalued!
The Calculation
We use what is known as a 2-stage model, which simply means we have two different periods of growth rates for the company's cash flows. Generally the first stage is higher growth, and the second stage is a lower growth phase. To begin with, we have to get estimates of the next ten years of cash flows. Where possible we use analyst estimates, but when these aren't available we extrapolate the previous free cash flow (FCF) from the last estimate or reported value. We assume companies with shrinking free cash flow will slow their rate of shrinkage, and that companies with growing free cash flow will see their growth rate slow, over this period. We do this to reflect that growth tends to slow more in the early years than it does in later years.
A DCF is all about the idea that a dollar in the future is less valuable than a dollar today, so we discount the value of these future cash flows to their estimated value in today's dollars:
10-year free cash flow (FCF) estimate
| 2023 | 2024 | 2025 | 2026 | 2027 | 2028 | 2029 | 2030 | 2031 | 2032 | |
| Levered FCF ($, Millions) | US$60.5m | US$90.5m | US$109.4m | US$125.9m | US$140.1m | US$151.9m | US$161.8m | US$170.1m | US$177.2m | US$183.5m |
| Growth Rate Estimate Source | Analyst x5 | Analyst x3 | Est @ 20.82% | Est @ 15.17% | Est @ 11.21% | Est @ 8.44% | Est @ 6.5% | Est @ 5.15% | Est @ 4.2% | Est @ 3.53% |
| Present Value ($, Millions) Discounted @ 8.0% | US$56.0 | US$77.6 | US$86.8 | US$92.6 | US$95.3 | US$95.7 | US$94.4 | US$91.9 | US$88.6 | US$85.0 |
("Est" = FCF growth rate estimated by Simply Wall St)
Present Value of 10-year Cash Flow (PVCF) = US$863m
We now need to calculate the Terminal Value, which accounts for all the future cash flows after this ten year period. For a number of reasons a very conservative growth rate is used that cannot exceed that of a country's GDP growth. In this case we have used the 5-year average of the 10-year government bond yield (2.0%) to estimate future growth. In the same way as with the 10-year 'growth' period, we discount future cash flows to today's value, using a cost of equity of 8.0%.
Terminal Value (TV)= FCF2032 × (1 + g) ÷ (r – g) = US$183m× (1 + 2.0%) ÷ (8.0%– 2.0%) = US$3.1b
Present Value of Terminal Value (PVTV)= TV / (1 + r)10= US$3.1b÷ ( 1 + 8.0%)10= US$1.4b
The total value, or equity value, is then the sum of the present value of the future cash flows, which in this case is US$2.3b. The last step is to then divide the equity value by the number of shares outstanding. Compared to the current share price of US$11.2, the company appears about fair value at a 12% discount to where the stock price trades currently. Remember though, that this is just an approximate valuation, and like any complex formula - garbage in, garbage out.
Important Assumptions
We would point out that the most important inputs to a discounted cash flow are the discount rate and of course the actual cash flows. Part of investing is coming up with your own evaluation of a company's future performance, so try the calculation yourself and check your own assumptions. The DCF also does not consider the possible cyclicality of an industry, or a company's future capital requirements, so it does not give a full picture of a company's potential performance. Given that we are looking at N-able as potential shareholders, the cost of equity is used as the discount rate, rather than the cost of capital (or weighted average cost of capital, WACC) which accounts for debt. In this calculation we've used 8.0%, which is based on a levered beta of 1.082. Beta is a measure of a stock's volatility, compared to the market as a whole. We get our beta from the industry average beta of globally comparable companies, with an imposed limit between 0.8 and 2.0, which is a reasonable range for a stable business.
Looking Ahead:
Whilst important, the DCF calculation is only one of many factors that you need to assess for a company. DCF models are not the be-all and end-all of investment valuation. Rather it should be seen as a guide to "what assumptions need to be true for this stock to be under/overvalued?" For instance, if the terminal value growth rate is adjusted slightly, it can dramatically alter the overall result. For N-able, we've put together three additional aspects you should assess:
- Risks: Take risks, for example - N-able has 1 warning sign we think you should be aware of.
- Future Earnings: How does NABL's growth rate compare to its peers and the wider market? Dig deeper into the analyst consensus number for the upcoming years by interacting with our free analyst growth expectation chart.
- Other Solid Businesses: Low debt, high returns on equity and good past performance are fundamental to a strong business. Why not explore our interactive list of stocks with solid business fundamentals to see if there are other companies you may not have considered!
PS. Simply Wall St updates its DCF calculation for every American stock every day, so if you want to find the intrinsic value of any other stock just search here.
Valuation is complex, but we're here to simplify it.
Discover if N-able might be undervalued or overvalued with our detailed analysis, featuring fair value estimates, potential risks, dividends, insider trades, and its financial condition.
Access Free AnalysisHave feedback on this article? Concerned about the content? Get in touch with us directly. Alternatively, email editorial-team (at) simplywallst.com.
This article by Simply Wall St is general in nature. We provide commentary based on historical data and analyst forecasts only using an unbiased methodology and our articles are not intended to be financial advice. It does not constitute a recommendation to buy or sell any stock, and does not take account of your objectives, or your financial situation. We aim to bring you long-term focused analysis driven by fundamental data. Note that our analysis may not factor in the latest price-sensitive company announcements or qualitative material. Simply Wall St has no position in any stocks mentioned.
About NYSE:NABL
N-able
Provides cloud-based software solutions for managed service providers in the United States, the United Kingdom, and internationally.
Solid track record with adequate balance sheet.
