Advertisement
- United States
- /
- IT
- /
- NYSE:EPAM
Where Does EPAM Stand After 36% Fall and Sluggish Tech Consulting Demand in 2025?

Simply Wall St
Reviewed by Bailey Pemberton
If you’ve been watching EPAM Systems lately, you’re likely wondering what’s really driving the swings in its stock price, and whether now is the right moment to act. After all, the stock closed recently at $146.98, down about 1.9% in the past week and nearly 36% year to date. The pain has stretched beyond 2024 as well, with EPAM off more than 26% in the past year and sliding by over 56% in the last three years. For a company that’s long been considered a shining star among digital transformation specialists, those kinds of moves naturally raise eyebrows and questions about where the business truly stands.
Some of the recent turbulence can be traced back to shifting market sentiment about technology consulting and the uncertainties facing global IT spending. As investors reassess the prospects and risks of this sector, EPAM’s stock has been caught in the crosscurrents, making this a story not just about one company but also about broader market dynamics. Yet, what stands out is EPAM’s value score, currently sitting at 5 out of a possible 6, which signals the company stacks up as undervalued by most standard checks, despite its recent rough patch.
So is EPAM a hidden bargain or a value trap? Let’s break down how traditional valuation methods stack up for this company and stay with me to the end, because there’s an even better way to cut through the noise and see if EPAM is truly a smart buy right now.
Why EPAM Systems is lagging behind its peers
Approach 1: EPAM Systems Discounted Cash Flow (DCF) Analysis
The Discounted Cash Flow (DCF) model offers a way to value a company by forecasting its future cash flows and then discounting those expected earnings back to their present value. This allows investors to estimate what a business is truly worth right now, based on its future cash flow potential rather than just current earnings or market sentiments.
For EPAM Systems, the latest reported Free Cash Flow is approximately $408 million. Over the next five years, analyst projections suggest steady annual growth, with cash flows projected to reach about $742 million by the end of 2029. Beyond that, further increases are extrapolated using reasonable growth estimates provided by Simply Wall St, extending outlooks through 2035.
All cash flows and valuations are calculated in US dollars and reflect estimates using the 2 Stage Free Cash Flow to Equity model. According to the latest DCF valuation, EPAM’s intrinsic value comes in at $218.63 per share. Compared to its recent closing price of $146.98, this suggests the stock is trading at a 32.8% discount to its estimated fair value. This makes it appear significantly undervalued using this approach.
Result: UNDERVALUED
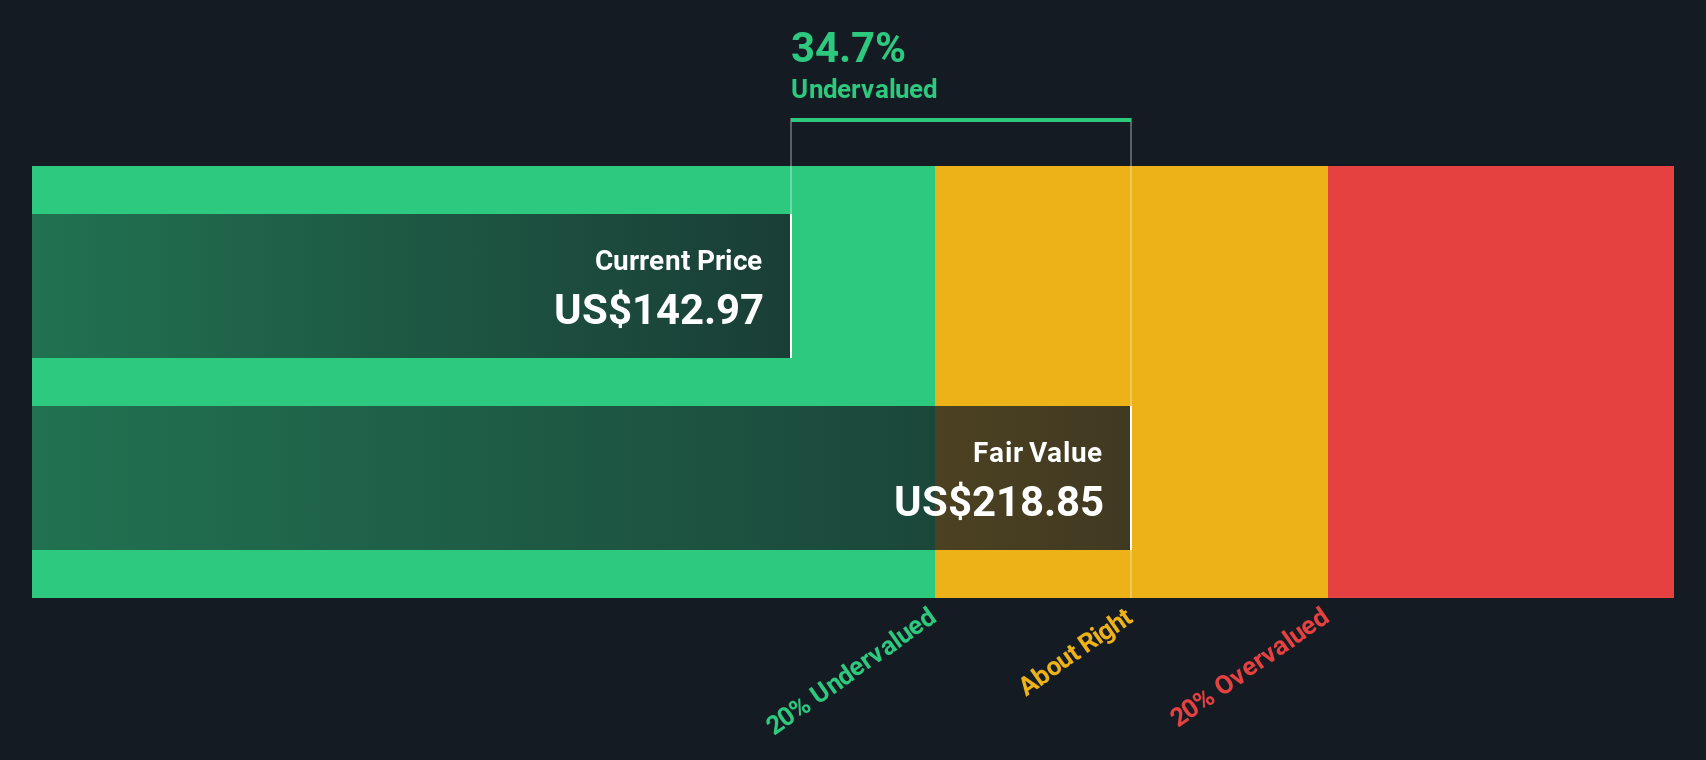
Our Discounted Cash Flow (DCF) analysis suggests EPAM Systems is undervalued by 32.8%. Track this in your watchlist or portfolio, or discover more undervalued stocks.
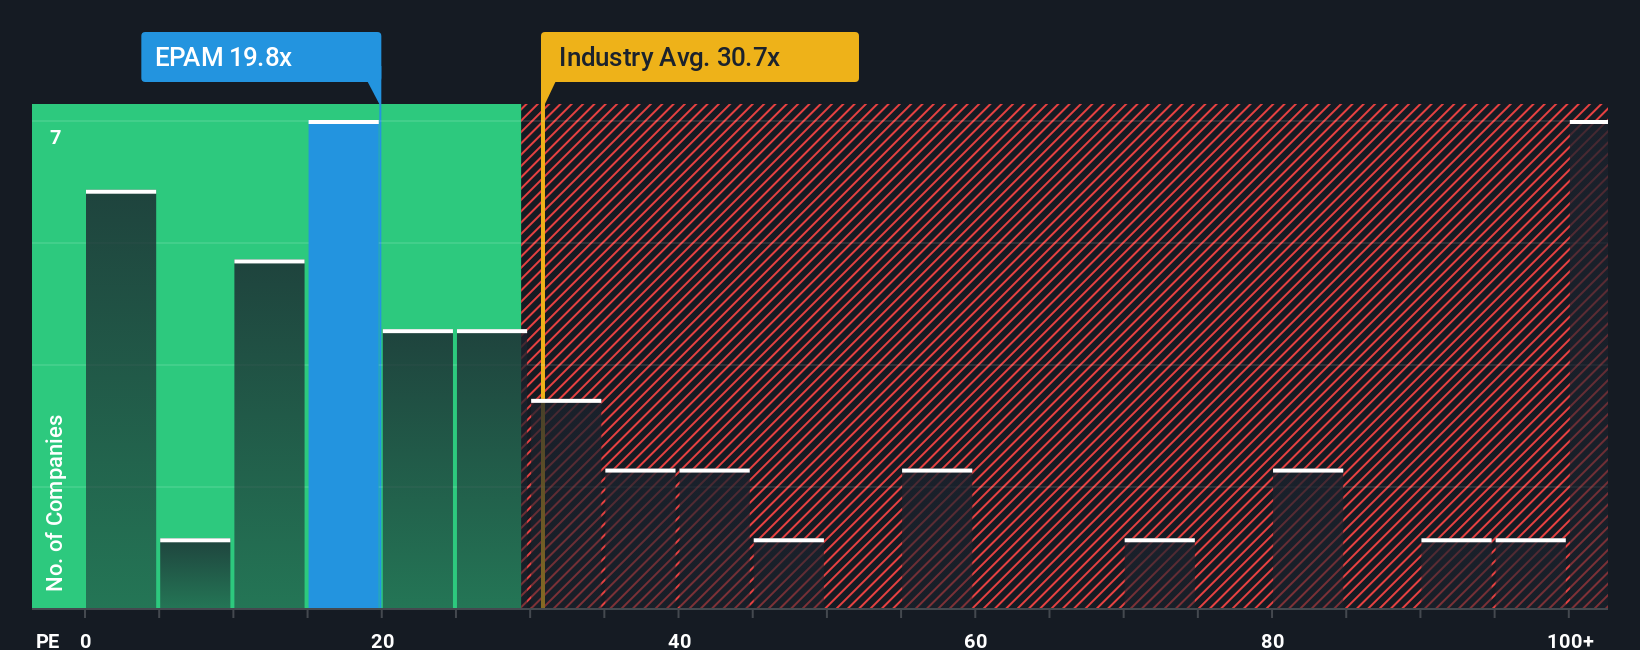
Approach 2: EPAM Systems Price vs Earnings (PE)
The Price-to-Earnings (PE) ratio is widely used to value profitable companies because it offers a direct way to see how much investors are willing to pay for a dollar of earnings. For established businesses like EPAM Systems, which consistently generate profits, the PE ratio helps put today’s share price in the context of current and expected earnings power.
What counts as a "normal" or "fair" PE ratio depends on a company’s growth outlook, profitability, and perceived risks. Companies growing faster or operating with higher margins often command higher PE multiples. Those with slower growth or more uncertainty typically trade at lower ratios.
Looking at EPAM Systems, the stock trades at a PE of 20.41x. For comparison, its industry average PE stands at 32.21x, while the peer group average is 16.66x. EPAM’s PE sits below the industry average but above its typical peer, signaling mixed market sentiment about its outlook.
Now, let’s consider Simply Wall St’s "Fair Ratio" for EPAM, which is calculated to be 31.70x. This proprietary metric takes into account not just simple benchmarks but also factors like the company’s earnings growth, profitability, industry dynamics, profit margins, and market cap. Unlike basic peer or industry comparisons, the Fair Ratio aims to provide a tailored view of what multiple is genuinely justified for EPAM in today’s market, given both opportunities and risks.
Comparing the Fair Ratio of 31.70x to EPAM’s current 20.41x, the stock appears undervalued on this metric by a significant margin.
Result: UNDERVALUED
PE ratios tell one story, but what if the real opportunity lies elsewhere? Discover companies where insiders are betting big on explosive growth.
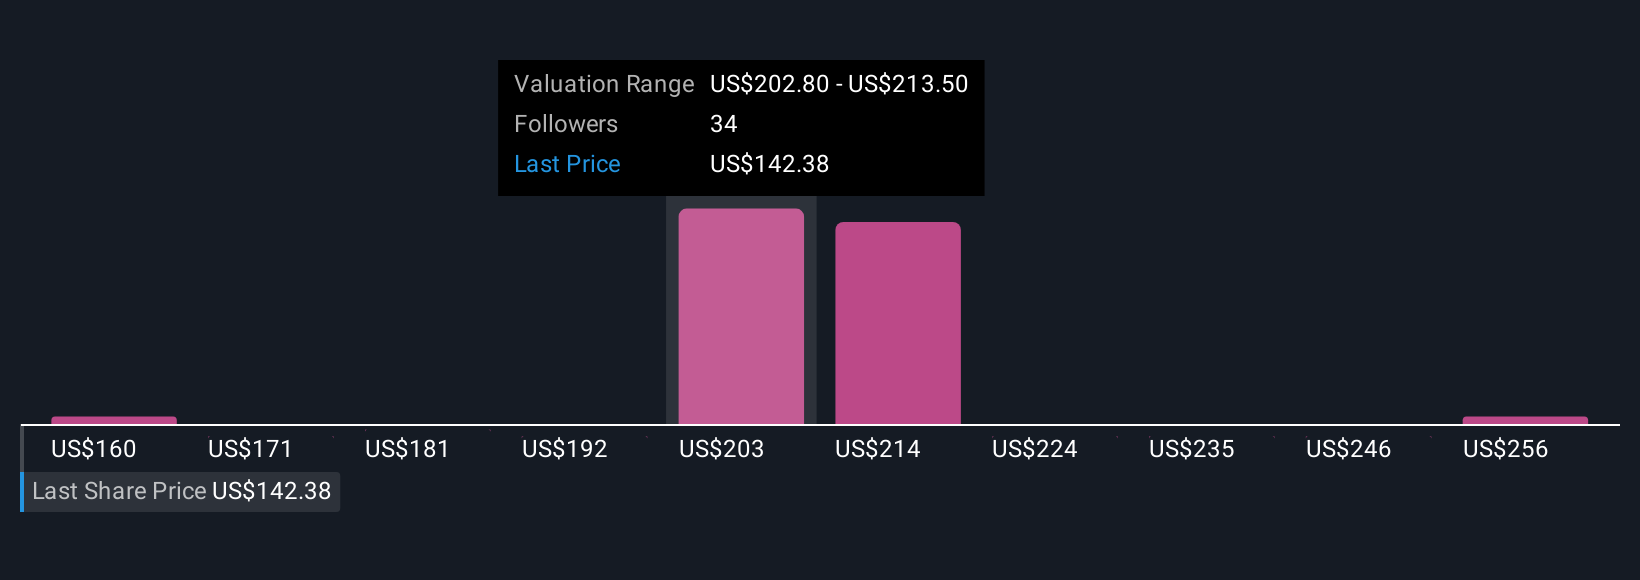
Upgrade Your Decision Making: Choose your EPAM Systems Narrative
Earlier, we mentioned that there is an even better way to understand valuation, so let’s introduce you to Narratives. A Narrative is essentially your investment story––it’s how you connect your perspective on a company’s future with the numbers behind its fair value, like your estimates of future revenue, earnings, and profit margins. Narratives link what’s happening within the business and the broader industry (the story) directly to financial forecasts, and then to an actionable fair value for the stock.
Narratives are intuitive and accessible, available right now to millions of investors on Simply Wall St’s Community page, and are designed to help you decide whether to buy or sell by comparing the fair value in your Narrative to today’s share price. The best part: Narratives automatically update as new information comes in, such as company news or earnings, so your conclusions stay relevant. For example, at the moment, the highest EPAM Systems Narrative targets see cloud migration and expanding AI services as major long-term growth drivers and set a fair value of $246.00. Meanwhile, the most cautious focus on competition and evolving technology risks, landing at $171.00. This illustrates just how powerful it is to anchor your decisions to a story that aligns with your own view of the company’s future.
Do you think there's more to the story for EPAM Systems? Create your own Narrative to let the Community know!
This article by Simply Wall St is general in nature. We provide commentary based on historical data and analyst forecasts only using an unbiased methodology and our articles are not intended to be financial advice. It does not constitute a recommendation to buy or sell any stock, and does not take account of your objectives, or your financial situation. We aim to bring you long-term focused analysis driven by fundamental data. Note that our analysis may not factor in the latest price-sensitive company announcements or qualitative material. Simply Wall St has no position in any stocks mentioned.
Valuation is complex, but we're here to simplify it.
Discover if EPAM Systems might be undervalued or overvalued with our detailed analysis, featuring fair value estimates, potential risks, dividends, insider trades, and its financial condition.
Access Free AnalysisHave feedback on this article? Concerned about the content? Get in touch with us directly. Alternatively, email editorial-team@simplywallst.com
About NYSE:EPAM
EPAM Systems
Provides digital platform engineering and software development services worldwide.
Flawless balance sheet and undervalued.
Similar Companies
Market Insights

Advertisement
Community Narratives
A formidable player in AI and enterprise computing.
Fair Value US$210.00|3.9% overvalued
CO
Community Contributor
IREN's Bold Moves in Sustainable Bitcoin Mining & AI Data Centers
Fair Value US$89.00|21.8% undervalued
BL
Community Contributor
Cooling the Champions: The Aussie Tech Behind F1's Victories
Fair Value AU$12.40|40.6% undervalued
TR
Community Contributor