

CI&T (NYSE:CINT) Full Year 2024 Results
Key Financial Results
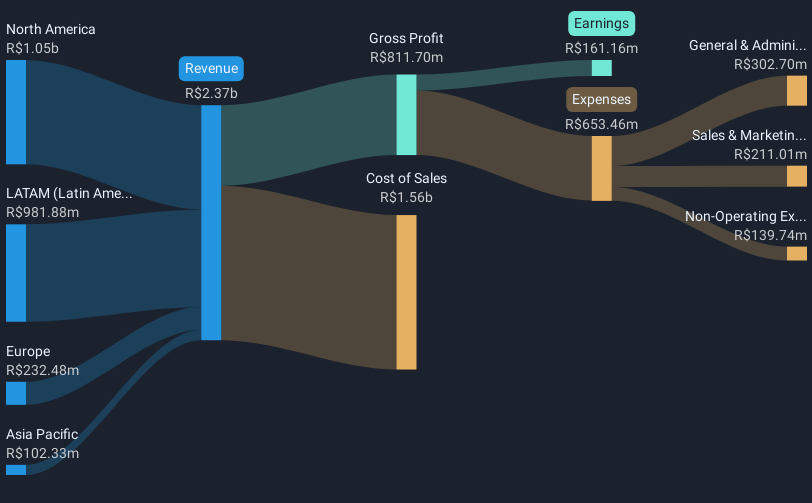
- Revenue: R$2.37b (up 6.0% from FY 2023).
- Net income: R$161.2m (up 22% from FY 2023).
- Profit margin: 6.8% (up from 5.9% in FY 2023). The increase in margin was driven by higher revenue.
- EPS: R$1.19 (up from R$0.97 in FY 2023).
All figures shown in the chart above are for the trailing 12 month (TTM) period
CI&T Revenues Disappoint
Revenue missed analyst estimates by 1.2%. Earnings per share (EPS) was mostly in line with analyst estimates.
The primary driver behind last 12 months revenue was the North America segment contributing a total revenue of R$1.05b (44% of total revenue). Notably, cost of sales worth R$1.56b amounted to 66% of total revenue thereby underscoring the impact on earnings. The largest operating expense was General & Administrative costs, amounting to R$302.7m (47% of total expenses). Explore how CINT's revenue and expenses shape its earnings.
Looking ahead, revenue is forecast to grow 15% p.a. on average during the next 3 years, compared to a 9.0% growth forecast for the IT industry in the US.
Performance of the American IT industry.
The company's shares are down 10% from a week ago.
Balance Sheet Analysis
Just as investors must consider earnings, it is also important to take into account the strength of a company's balance sheet. See our latest analysis on CI&T's balance sheet health.
If you're looking to trade CI&T, open an account with the lowest-cost platform trusted by professionals, Interactive Brokers.
With clients in over 200 countries and territories, and access to 160 markets, IBKR lets you trade stocks, options, futures, forex, bonds and funds from a single integrated account.
Enjoy no hidden fees, no account minimums, and FX conversion rates as low as 0.03%, far better than what most brokers offer.
Sponsored ContentNew: AI Stock Screener & Alerts
Our new AI Stock Screener scans the market every day to uncover opportunities.
• Dividend Powerhouses (3%+ Yield)
• Undervalued Small Caps with Insider Buying
• High growth Tech and AI Companies
Or build your own from over 50 metrics.
Have feedback on this article? Concerned about the content? Get in touch with us directly. Alternatively, email editorial-team (at) simplywallst.com.
This article by Simply Wall St is general in nature. We provide commentary based on historical data and analyst forecasts only using an unbiased methodology and our articles are not intended to be financial advice. It does not constitute a recommendation to buy or sell any stock, and does not take account of your objectives, or your financial situation. We aim to bring you long-term focused analysis driven by fundamental data. Note that our analysis may not factor in the latest price-sensitive company announcements or qualitative material. Simply Wall St has no position in any stocks mentioned.
About NYSE:CINT
CI&T
Engages in the provision of strategy, design, and software engineering services worldwide.
Very undervalued with solid track record.
Similar Companies
Market Insights

Community Narratives

