- United States
- /
- Software
- /
- NasdaqGS:ZM
Is Zoom Video Communications, Inc. (NASDAQ:ZM) Trading At A 50% Discount?


Key Insights
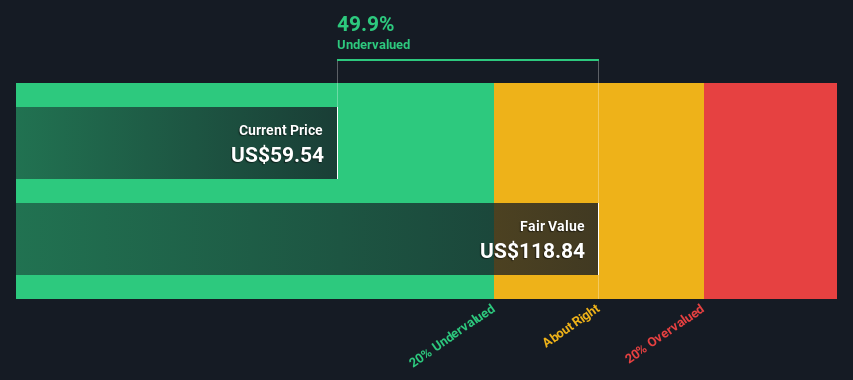
- Zoom Video Communications' estimated fair value is US$119 based on 2 Stage Free Cash Flow to Equity
- Zoom Video Communications' US$59.54 share price signals that it might be 50% undervalued
- The US$78.44 analyst price target for ZM is 34% less than our estimate of fair value
How far off is Zoom Video Communications, Inc. (NASDAQ:ZM) from its intrinsic value? Using the most recent financial data, we'll take a look at whether the stock is fairly priced by projecting its future cash flows and then discounting them to today's value. This will be done using the Discounted Cash Flow (DCF) model. There's really not all that much to it, even though it might appear quite complex.
Companies can be valued in a lot of ways, so we would point out that a DCF is not perfect for every situation. If you want to learn more about discounted cash flow, the rationale behind this calculation can be read in detail in the Simply Wall St analysis model.
Check out our latest analysis for Zoom Video Communications
Step By Step Through The Calculation
We use what is known as a 2-stage model, which simply means we have two different periods of growth rates for the company's cash flows. Generally the first stage is higher growth, and the second stage is a lower growth phase. To begin with, we have to get estimates of the next ten years of cash flows. Where possible we use analyst estimates, but when these aren't available we extrapolate the previous free cash flow (FCF) from the last estimate or reported value. We assume companies with shrinking free cash flow will slow their rate of shrinkage, and that companies with growing free cash flow will see their growth rate slow, over this period. We do this to reflect that growth tends to slow more in the early years than it does in later years.
Generally we assume that a dollar today is more valuable than a dollar in the future, so we need to discount the sum of these future cash flows to arrive at a present value estimate:
10-year free cash flow (FCF) estimate
| 2024 | 2025 | 2026 | 2027 | 2028 | 2029 | 2030 | 2031 | 2032 | 2033 | |
| Levered FCF ($, Millions) | US$1.37b | US$1.50b | US$1.62b | US$1.80b | US$1.81b | US$1.87b | US$1.92b | US$1.97b | US$2.02b | US$2.07b |
| Growth Rate Estimate Source | Analyst x19 | Analyst x23 | Analyst x21 | Analyst x9 | Analyst x3 | Analyst x3 | Est @ 2.71% | Est @ 2.58% | Est @ 2.50% | Est @ 2.43% |
| Present Value ($, Millions) Discounted @ 6.8% | US$1.3k | US$1.3k | US$1.3k | US$1.4k | US$1.3k | US$1.3k | US$1.2k | US$1.2k | US$1.1k | US$1.1k |
("Est" = FCF growth rate estimated by Simply Wall St)
Present Value of 10-year Cash Flow (PVCF) = US$12b
We now need to calculate the Terminal Value, which accounts for all the future cash flows after this ten year period. For a number of reasons a very conservative growth rate is used that cannot exceed that of a country's GDP growth. In this case we have used the 5-year average of the 10-year government bond yield (2.3%) to estimate future growth. In the same way as with the 10-year 'growth' period, we discount future cash flows to today's value, using a cost of equity of 6.8%.
Terminal Value (TV)= FCF2033 × (1 + g) ÷ (r – g) = US$2.1b× (1 + 2.3%) ÷ (6.8%– 2.3%) = US$47b
Present Value of Terminal Value (PVTV)= TV / (1 + r)10= US$47b÷ ( 1 + 6.8%)10= US$24b
The total value is the sum of cash flows for the next ten years plus the discounted terminal value, which results in the Total Equity Value, which in this case is US$37b. The last step is to then divide the equity value by the number of shares outstanding. Compared to the current share price of US$59.5, the company appears quite undervalued at a 50% discount to where the stock price trades currently. Remember though, that this is just an approximate valuation, and like any complex formula - garbage in, garbage out.
Important Assumptions
Now the most important inputs to a discounted cash flow are the discount rate, and of course, the actual cash flows. You don't have to agree with these inputs, I recommend redoing the calculations yourself and playing with them. The DCF also does not consider the possible cyclicality of an industry, or a company's future capital requirements, so it does not give a full picture of a company's potential performance. Given that we are looking at Zoom Video Communications as potential shareholders, the cost of equity is used as the discount rate, rather than the cost of capital (or weighted average cost of capital, WACC) which accounts for debt. In this calculation we've used 6.8%, which is based on a levered beta of 0.984. Beta is a measure of a stock's volatility, compared to the market as a whole. We get our beta from the industry average beta of globally comparable companies, with an imposed limit between 0.8 and 2.0, which is a reasonable range for a stable business.
SWOT Analysis for Zoom Video Communications
- Earnings growth over the past year exceeded the industry.
- Currently debt free.
- Shareholders have been diluted in the past year.
- Annual earnings are forecast to grow for the next 3 years.
- Good value based on P/E ratio and estimated fair value.
- Annual earnings are forecast to grow slower than the American market.
Looking Ahead:
Whilst important, the DCF calculation is only one of many factors that you need to assess for a company. It's not possible to obtain a foolproof valuation with a DCF model. Instead the best use for a DCF model is to test certain assumptions and theories to see if they would lead to the company being undervalued or overvalued. For example, changes in the company's cost of equity or the risk free rate can significantly impact the valuation. Can we work out why the company is trading at a discount to intrinsic value? For Zoom Video Communications, we've put together three additional items you should assess:
- Risks: We feel that you should assess the 1 warning sign for Zoom Video Communications we've flagged before making an investment in the company.
- Future Earnings: How does ZM's growth rate compare to its peers and the wider market? Dig deeper into the analyst consensus number for the upcoming years by interacting with our free analyst growth expectation chart.
- Other High Quality Alternatives: Do you like a good all-rounder? Explore our interactive list of high quality stocks to get an idea of what else is out there you may be missing!
PS. The Simply Wall St app conducts a discounted cash flow valuation for every stock on the NASDAQGS every day. If you want to find the calculation for other stocks just search here.
If you're looking to trade Zoom Communications, open an account with the lowest-cost platform trusted by professionals, Interactive Brokers.
With clients in over 200 countries and territories, and access to 160 markets, IBKR lets you trade stocks, options, futures, forex, bonds and funds from a single integrated account.
Enjoy no hidden fees, no account minimums, and FX conversion rates as low as 0.03%, far better than what most brokers offer.
Sponsored ContentValuation is complex, but we're here to simplify it.
Discover if Zoom Communications might be undervalued or overvalued with our detailed analysis, featuring fair value estimates, potential risks, dividends, insider trades, and its financial condition.
Access Free AnalysisHave feedback on this article? Concerned about the content? Get in touch with us directly. Alternatively, email editorial-team (at) simplywallst.com.
This article by Simply Wall St is general in nature. We provide commentary based on historical data and analyst forecasts only using an unbiased methodology and our articles are not intended to be financial advice. It does not constitute a recommendation to buy or sell any stock, and does not take account of your objectives, or your financial situation. We aim to bring you long-term focused analysis driven by fundamental data. Note that our analysis may not factor in the latest price-sensitive company announcements or qualitative material. Simply Wall St has no position in any stocks mentioned.
About NasdaqGS:ZM
Zoom Communications
Provides an Artificial Intelligence-first work platform for human connection in the Americas, the Asia Pacific, Europe, the Middle East, and Africa.
Very undervalued with flawless balance sheet.
Similar Companies
Market Insights

Community Narratives

