Advertisement
- United States
- /
- Software
- /
- NasdaqGS:WDAY
Is There Now an Opportunity in Workday After Recent AI Partnership Announcement?

Simply Wall St
Reviewed by Bailey Pemberton
Thinking about what to do with Workday stock? You are not alone. Whether you are already invested or just watching from the sidelines, the recent moves in Workday’s share price are sending a mixed message that is tough to ignore. Over the past year, shares have slipped 2.6% lower and they are down 7.4% so far this year. However, zoom out to a three-year period and you will spot a robust gain of 63.4%. In the past month, the stock managed a small positive turn of 0.9% after a choppy start to the year.
What is driving this push and pull? Investors are weighing optimism about cloud software adoption against broader market volatility and changing risk perceptions after some sector-wide shakeups. In the longer term, Workday’s resilience hints that the company may still be carving out a strong position in the ever-evolving enterprise software market. Still, there is no denying that lately, price swings reflect more caution than excitement.
So what does that mean for valuation? By crunching the numbers, Workday lands a value score of 3 out of 6, signaling it currently passes half of our tests for being undervalued. That leaves us with an intriguing puzzle: Is Workday quietly offering opportunity, or do the risk signals outweigh the upside? Let’s break down how we measure value, and later on, explore a better way to get a truer read on whether the stock is worth your attention.
Why Workday is lagging behind its peers
Approach 1: Workday Discounted Cash Flow (DCF) Analysis
The Discounted Cash Flow (DCF) model is a tried and true approach for estimating a stock’s intrinsic value by projecting the company’s future cash flows and then discounting them back to their present worth. For Workday, this method relies on forecasts of Free Cash Flow (FCF), which is a crucial measure of the cash available to shareholders after accounting for operational expenses and investments.
Currently, Workday generates $2.32 billion in Free Cash Flow. Analyst estimates extend out five years and suggest robust growth, with FCF forecasted to reach $5.02 billion by 2030. After the first five years, additional growth projections are extrapolated to provide a long-term view. These projections give us a sense of the company’s earnings potential not only in the next few years, but also well into the next decade.
According to this model, the estimated intrinsic value of Workday is $332.61 per share, indicating the stock trades at a 29.9% discount to its calculated fair value. This implies that, based on these numbers, Workday may be significantly undervalued at this time compared to what its future cash flows are worth.
Result: UNDERVALUED
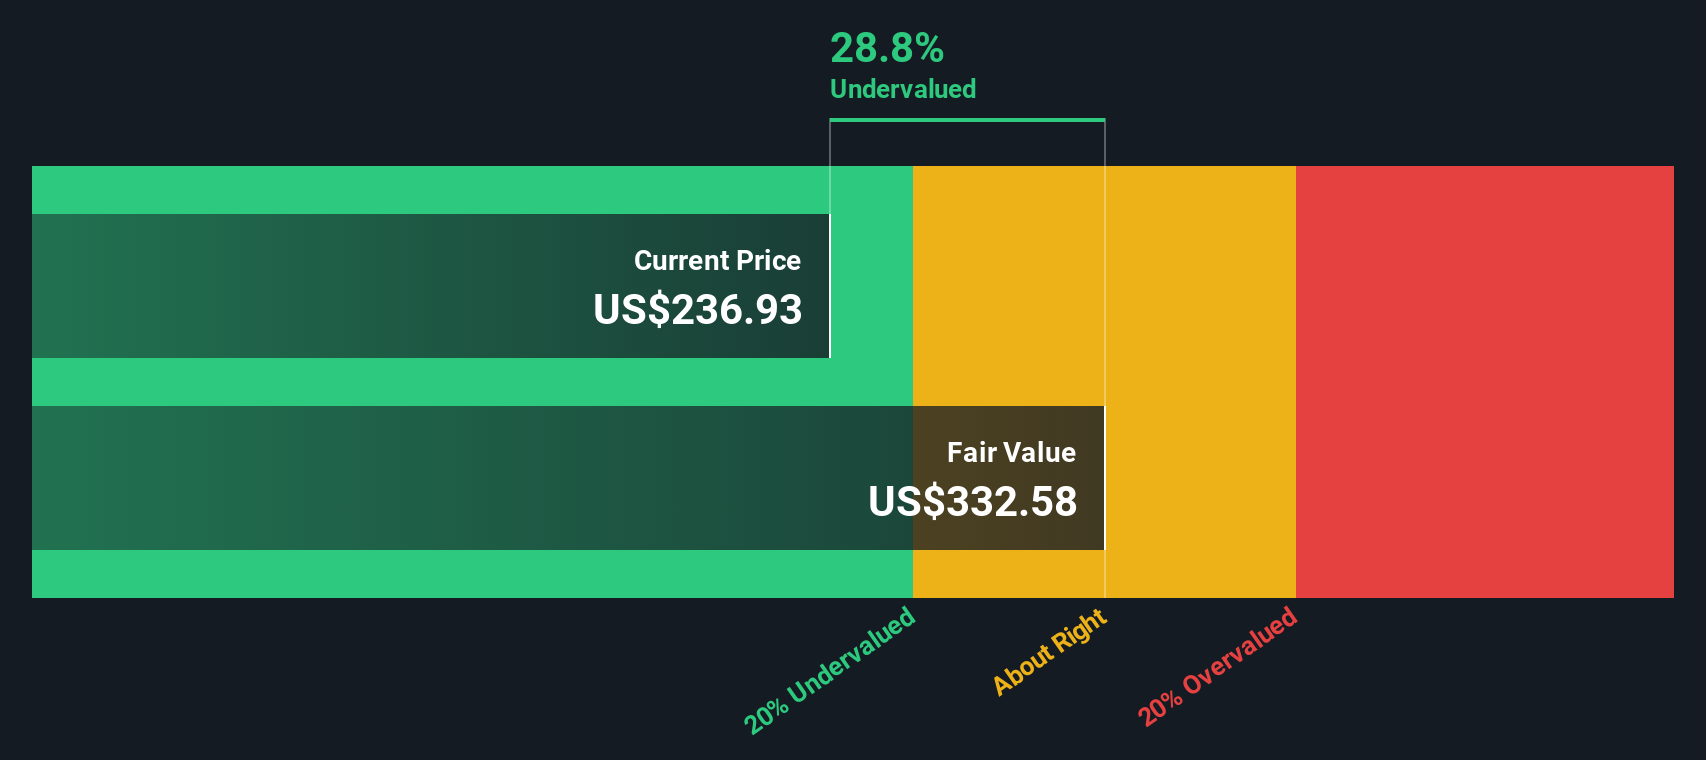
Our Discounted Cash Flow (DCF) analysis suggests Workday is undervalued by 29.9%. Track this in your watchlist or portfolio, or discover more undervalued stocks.
Approach 2: Workday Price vs Earnings
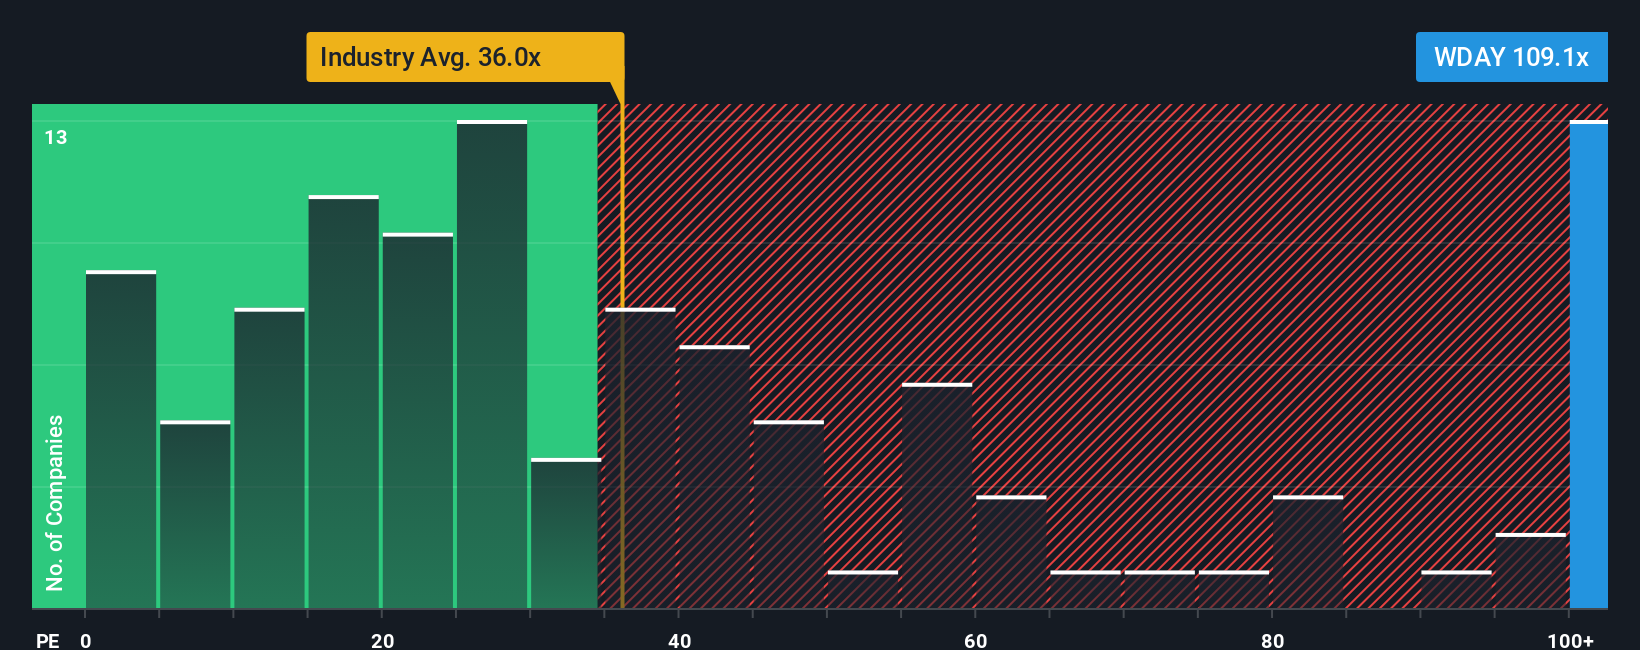
The Price-to-Earnings (PE) ratio is a widely recognized valuation metric, especially for companies like Workday that are solidly profitable. This simple multiple tells us how much investors are willing to pay today for each dollar of a company’s earnings, making it a good starting point for comparison with both peers and the broader industry.
Growth expectations and risk profile play a big part in what counts as a "normal" or acceptable PE ratio. Fast-growing businesses or those seen as safer can often command higher PE multiples, whereas riskier or slower-growing firms usually trade at lower ones. In Workday’s case, the company’s current PE ratio stands at 106.8x, which is much higher than the software industry average of 35.6x and even above the average for its peers at 61.8x.
To help give a more tailored benchmark, Simply Wall St calculates a “Fair Ratio.” In this case, the Fair Ratio is 55.3x for Workday. The Fair Ratio is designed to reflect a multiple that takes into account not just peer or industry standards, but also factors specific to Workday like its growth trajectory, profit margins, market cap, and overall risk level. This makes it a more robust indicator than simple peer or industry comparisons because it adjusts for what makes each company unique.
Comparing the Fair Ratio to Workday’s actual PE, the stock is trading well above what would be considered justified even after accounting for its growth and strengths. This points toward Workday being overvalued based on the current price-to-earnings metric.
Result: OVERVALUED
PE ratios tell one story, but what if the real opportunity lies elsewhere? Discover companies where insiders are betting big on explosive growth.
Upgrade Your Decision Making: Choose your Workday Narrative
Earlier we mentioned that there's an even better way to understand valuation, so let's introduce you to Narratives. A Narrative is a simple, intuitive way to capture your personal perspective or story about a company. By combining your assumptions for fair value, future revenues, earnings, and margins, you can bring the numbers to life. Instead of treating investing as just a matter of ratios or consensus estimates, Narratives help you link a company’s real-world story to a financial forecast and ultimately a fair value. This provides a dynamic bridge between your investment thesis and the numbers.
Narratives are available directly within Simply Wall St’s Community page, used by millions of investors worldwide. They make it easy for anyone to map out how and why a stock like Workday could be undervalued or overvalued by comparing what you believe is a fair value to the current market price, and by revisiting your conclusions whenever new news or earnings are released. For example, one investor’s Narrative for Workday assumes global AI adoption will boost earnings and justifies a fair value as high as $340 per share. Another, more cautious view, factors in competitive risks and regulatory challenges and lands on just $220 per share. With Narratives, you can see, build, and refine your own investment view instantly and with real context.
Do you think there's more to the story for Workday? Create your own Narrative to let the Community know!
This article by Simply Wall St is general in nature. We provide commentary based on historical data and analyst forecasts only using an unbiased methodology and our articles are not intended to be financial advice. It does not constitute a recommendation to buy or sell any stock, and does not take account of your objectives, or your financial situation. We aim to bring you long-term focused analysis driven by fundamental data. Note that our analysis may not factor in the latest price-sensitive company announcements or qualitative material. Simply Wall St has no position in any stocks mentioned.
Valuation is complex, but we're here to simplify it.
Discover if Workday might be undervalued or overvalued with our detailed analysis, featuring fair value estimates, potential risks, dividends, insider trades, and its financial condition.
Access Free AnalysisHave feedback on this article? Concerned about the content? Get in touch with us directly. Alternatively, email editorial-team@simplywallst.com
About NasdaqGS:WDAY
Workday
Provides enterprise cloud applications in the United States and internationally.
Flawless balance sheet with high growth potential.
Similar Companies
Market Insights

Advertisement
Community Narratives
Kodiak AI - a potential 100 bagger opportunity?
Fair Value US$14.00|41.9% undervalued
DA
Community Contributor
A Fair Price for a Great Business Facing Real Threats
Fair Value US$383.06|14.1% undervalued
IM
Community Contributor
AXON And Shopify Integration Will Unlock Global Mobile Advertising
Fair Value US$613.59|1.2% undervalued
AN
Based on Analyst Price Targets