
Advertisement
- United States
- /
- IT
- /
- NasdaqCM:RSSS
Is Research Solutions, Inc. (NASDAQ:RSSS) Worth US$2.7 Based On Its Intrinsic Value?
Key Insights
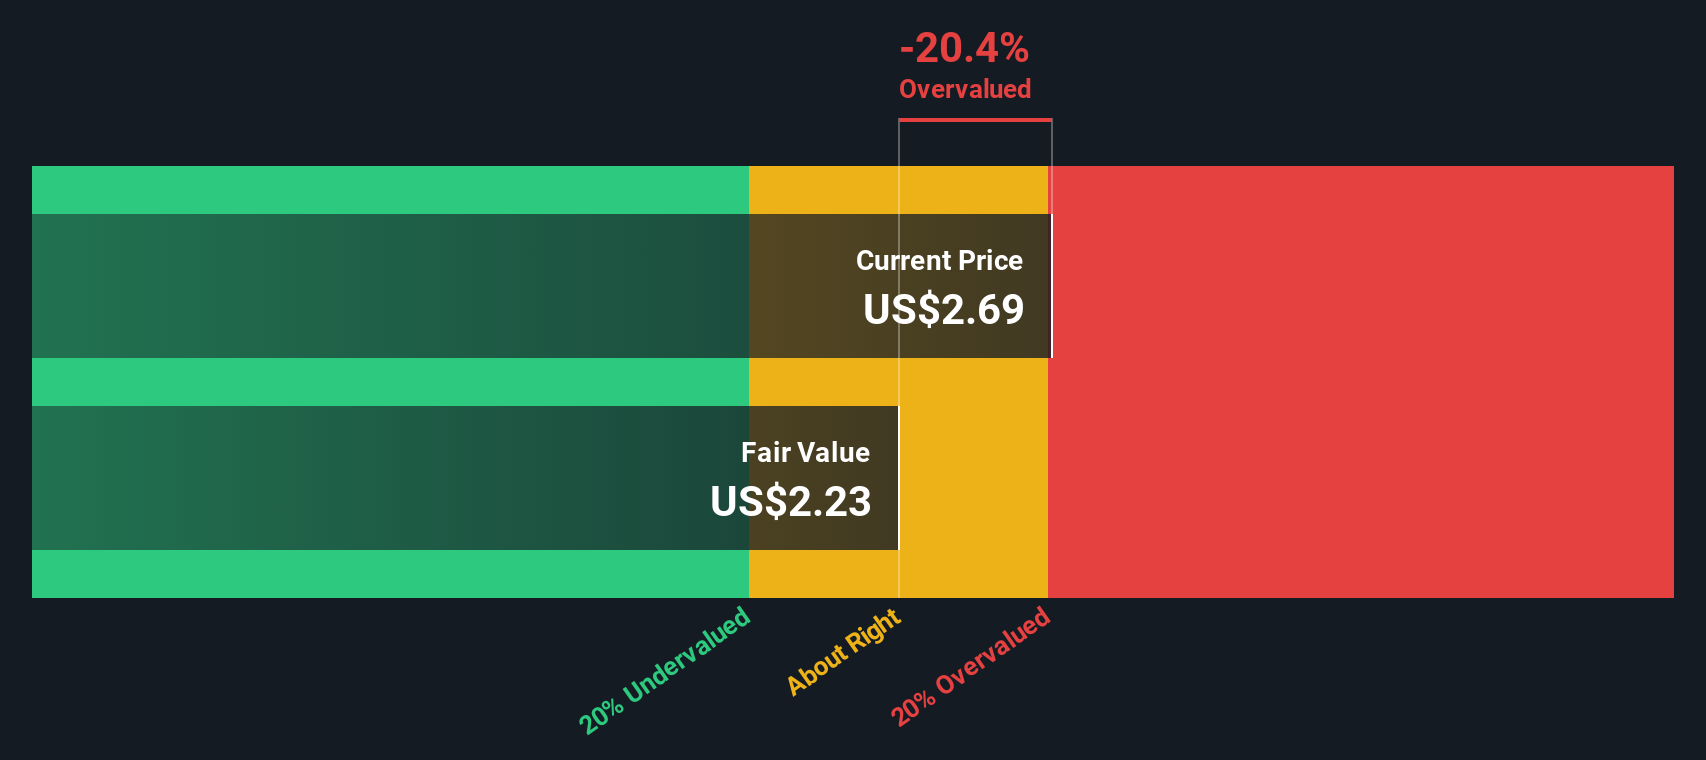
- Research Solutions' estimated fair value is US$2.23 based on 2 Stage Free Cash Flow to Equity
- Current share price of US$2.69 suggests Research Solutions is potentially 20% overvalued
- Analyst price target for RSSS is US$5.12, which is 129% above our fair value estimate
Today we will run through one way of estimating the intrinsic value of Research Solutions, Inc. (NASDAQ:RSSS) by estimating the company's future cash flows and discounting them to their present value. We will take advantage of the Discounted Cash Flow (DCF) model for this purpose. Believe it or not, it's not too difficult to follow, as you'll see from our example!
Remember though, that there are many ways to estimate a company's value, and a DCF is just one method. For those who are keen learners of equity analysis, the Simply Wall St analysis model here may be something of interest to you.
The Model
We use what is known as a 2-stage model, which simply means we have two different periods of growth rates for the company's cash flows. Generally the first stage is higher growth, and the second stage is a lower growth phase. To start off with, we need to estimate the next ten years of cash flows. Where possible we use analyst estimates, but when these aren't available we extrapolate the previous free cash flow (FCF) from the last estimate or reported value. We assume companies with shrinking free cash flow will slow their rate of shrinkage, and that companies with growing free cash flow will see their growth rate slow, over this period. We do this to reflect that growth tends to slow more in the early years than it does in later years.
Generally we assume that a dollar today is more valuable than a dollar in the future, so we need to discount the sum of these future cash flows to arrive at a present value estimate:
10-year free cash flow (FCF) forecast
| 2026 | 2027 | 2028 | 2029 | 2030 | 2031 | 2032 | 2033 | 2034 | 2035 | |
| Levered FCF ($, Millions) | US$5.30m | US$4.77m | US$4.47m | US$4.32m | US$4.25m | US$4.25m | US$4.28m | US$4.34m | US$4.42m | US$4.52m |
| Growth Rate Estimate Source | Analyst x1 | Est @ -10.06% | Est @ -6.16% | Est @ -3.43% | Est @ -1.52% | Est @ -0.18% | Est @ 0.75% | Est @ 1.41% | Est @ 1.87% | Est @ 2.19% |
| Present Value ($, Millions) Discounted @ 8.0% | US$4.9 | US$4.1 | US$3.5 | US$3.2 | US$2.9 | US$2.7 | US$2.5 | US$2.3 | US$2.2 | US$2.1 |
("Est" = FCF growth rate estimated by Simply Wall St)
Present Value of 10-year Cash Flow (PVCF) = US$30m
We now need to calculate the Terminal Value, which accounts for all the future cash flows after this ten year period. For a number of reasons a very conservative growth rate is used that cannot exceed that of a country's GDP growth. In this case we have used the 5-year average of the 10-year government bond yield (2.9%) to estimate future growth. In the same way as with the 10-year 'growth' period, we discount future cash flows to today's value, using a cost of equity of 8.0%.
Terminal Value (TV)= FCF2035 × (1 + g) ÷ (r – g) = US$4.5m× (1 + 2.9%) ÷ (8.0%– 2.9%) = US$91m
Present Value of Terminal Value (PVTV)= TV / (1 + r)10= US$91m÷ ( 1 + 8.0%)10= US$42m
The total value, or equity value, is then the sum of the present value of the future cash flows, which in this case is US$73m. In the final step we divide the equity value by the number of shares outstanding. Compared to the current share price of US$2.7, the company appears slightly overvalued at the time of writing. Valuations are imprecise instruments though, rather like a telescope - move a few degrees and end up in a different galaxy. Do keep this in mind.
Important Assumptions
The calculation above is very dependent on two assumptions. The first is the discount rate and the other is the cash flows. If you don't agree with these result, have a go at the calculation yourself and play with the assumptions. The DCF also does not consider the possible cyclicality of an industry, or a company's future capital requirements, so it does not give a full picture of a company's potential performance. Given that we are looking at Research Solutions as potential shareholders, the cost of equity is used as the discount rate, rather than the cost of capital (or weighted average cost of capital, WACC) which accounts for debt. In this calculation we've used 8.0%, which is based on a levered beta of 1.177. Beta is a measure of a stock's volatility, compared to the market as a whole. We get our beta from the industry average beta of globally comparable companies, with an imposed limit between 0.8 and 2.0, which is a reasonable range for a stable business.
View our latest analysis for Research Solutions
SWOT Analysis for Research Solutions
Strength
- Currently debt free.
Weakness
- Expensive based on P/S ratio and estimated fair value.
Opportunity
- Expected to breakeven next year.
- Has sufficient cash runway for more than 3 years based on current free cash flows.
Threat
- No apparent threats visible for RSSS.
Looking Ahead:
Valuation is only one side of the coin in terms of building your investment thesis, and it shouldn't be the only metric you look at when researching a company. DCF models are not the be-all and end-all of investment valuation. Preferably you'd apply different cases and assumptions and see how they would impact the company's valuation. For example, changes in the company's cost of equity or the risk free rate can significantly impact the valuation. Why is the intrinsic value lower than the current share price? For Research Solutions, we've put together three essential factors you should consider:
- Risks: To that end, you should be aware of the 1 warning sign we've spotted with Research Solutions .
- Future Earnings: How does RSSS's growth rate compare to its peers and the wider market? Dig deeper into the analyst consensus number for the upcoming years by interacting with our free analyst growth expectation chart.
- Other Solid Businesses: Low debt, high returns on equity and good past performance are fundamental to a strong business. Why not explore our interactive list of stocks with solid business fundamentals to see if there are other companies you may not have considered!
PS. Simply Wall St updates its DCF calculation for every American stock every day, so if you want to find the intrinsic value of any other stock just search here.
New: AI Stock Screener & Alerts
Our new AI Stock Screener scans the market every day to uncover opportunities.
• Dividend Powerhouses (3%+ Yield)
• Undervalued Small Caps with Insider Buying
• High growth Tech and AI Companies
Or build your own from over 50 metrics.
Have feedback on this article? Concerned about the content? Get in touch with us directly. Alternatively, email editorial-team (at) simplywallst.com.
This article by Simply Wall St is general in nature. We provide commentary based on historical data and analyst forecasts only using an unbiased methodology and our articles are not intended to be financial advice. It does not constitute a recommendation to buy or sell any stock, and does not take account of your objectives, or your financial situation. We aim to bring you long-term focused analysis driven by fundamental data. Note that our analysis may not factor in the latest price-sensitive company announcements or qualitative material. Simply Wall St has no position in any stocks mentioned.
About NasdaqCM:RSSS
Research Solutions
Through its subsidiaries, provides research cloud-based software-as-a-service software platform and related services to corporate, academic, government and individual researchers in the United States, Europe, and internationally.
Undervalued with excellent balance sheet.
Market Insights


Advertisement
Weekly Picks
DA


davidlsander on Optimi Health ·
OPTH: A licensed manufacturer already selling MDMA while peers still wait on trials
Fair Value:US$1259.6% undervalued
10 followersusers have followed this narrative
0 commentsusers have commented on this narrative
0 likesusers have liked this narrative
HA


HarishPK on Amdocs ·
Why Amdocs is a high conviction Buy for me?
Fair Value:US$82.0328.6% undervalued
36 followersusers have followed this narrative
3 commentsusers have commented on this narrative
12 likesusers have liked this narrative
IV

Ivoed on SBM Offshore ·
Why SBM Offshore’s €30 Share Price May Be Too Harsh On Its Backlog
Fair Value:€44.524.7% undervalued
22 followersusers have followed this narrative
0 commentsusers have commented on this narrative
5 likesusers have liked this narrative
CL


Clive_Thompson on Green Tea Group ·
One of China's Fastest-Growing Restaurant Chains Trades on Just 7x Earnings and an 8% Dividend
Fair Value:HK$8.719.3% undervalued
47 followersusers have followed this narrative
3 commentsusers have commented on this narrative
20 likesusers have liked this narrative
Recently Updated Narratives
PE

peter_4mgsy on Rhythm Pharmaceuticals ·
High-Growth Emerging Commercial Stage Biotech
Fair Value:US$13413.7% undervalued
1 followerusers have followed this narrative
0 commentsusers have commented on this narrative
0 likesusers have liked this narrative
WO


woodworthfund on FreightCar America ·
ALL ABOARD THE VALUE TRAIN: WHY $RAIL MIGHT BE HEADED NORTH - FREIGHTCAR AMERICA - Long term price target of $25
Fair Value:US$2568.4% undervalued
4 followersusers have followed this narrative
0 commentsusers have commented on this narrative
0 likesusers have liked this narrative
AS


AstrisCorporateAdvisory on Rigaku Holdings ·
Capitalizing on rising semiconductor complexity
Fair Value:JP¥2.52k22.9% undervalued
1 followerusers have followed this narrative
0 commentsusers have commented on this narrative
0 likesusers have liked this narrative
Popular Narratives
OS


oscargarcia on NVIDIA ·
The company that went from selling GPUs to gamers to becoming the AI arms dealer of the 21st century.
Fair Value:US$28022.3% undervalued
287 followersusers have followed this narrative
9 commentsusers have commented on this narrative
16 likesusers have liked this narrative
CU

CubanEros on Microsoft ·
A wonderful business at reasonable price.
Fair Value:US$419.9120.5% overvalued
153 followersusers have followed this narrative
0 commentsusers have commented on this narrative
8 likesusers have liked this narrative
KI

KiwiInvest on Amazon.com ·
Amazon's high growth, high tech segments propel its profits, while traditional segments plod along
Fair Value:US$475.0941.5% undervalued
172 followersusers have followed this narrative
1 commentusers have commented on this narrative
8 likesusers have liked this narrative
Trending Discussion
IA

ian_oii7z on Woodside Energy Group ·
Hey James! Thank you but I am not sure if I am reading this correctly as your analysis opens with "At A$36.602 per share, Woodside Energy Group (ASX: WDS) appears reasonably valued based on its existing operations and near-term production growth." I would like to say that the last time that WDS was above $36.00 per share was in October 2023, so I am a little confused by your statement w.r.t. current prices etc . Can you please explain?
1
|0
