Advertisement
- United States
- /
- Software
- /
- NasdaqGS:ROP
Roper Technologies, Inc. (NASDAQ:ROP) Shares Could Be 25% Below Their Intrinsic Value Estimate
Key Insights
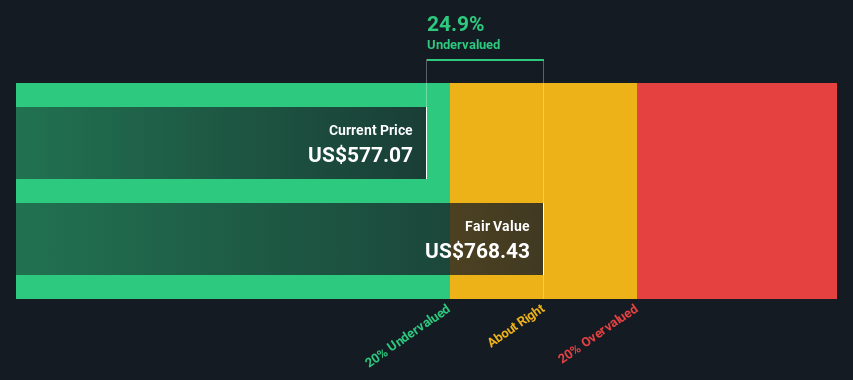
- The projected fair value for Roper Technologies is US$768 based on 2 Stage Free Cash Flow to Equity
- Roper Technologies' US$577 share price signals that it might be 25% undervalued
- Analyst price target for ROP is US$624 which is 19% below our fair value estimate
Today we will run through one way of estimating the intrinsic value of Roper Technologies, Inc. (NASDAQ:ROP) by taking the forecast future cash flows of the company and discounting them back to today's value. Our analysis will employ the Discounted Cash Flow (DCF) model. There's really not all that much to it, even though it might appear quite complex.
Remember though, that there are many ways to estimate a company's value, and a DCF is just one method. If you want to learn more about discounted cash flow, the rationale behind this calculation can be read in detail in the Simply Wall St analysis model.
We check all companies for important risks. See what we found for Roper Technologies in our free report.The Method
We use what is known as a 2-stage model, which simply means we have two different periods of growth rates for the company's cash flows. Generally the first stage is higher growth, and the second stage is a lower growth phase. In the first stage we need to estimate the cash flows to the business over the next ten years. Where possible we use analyst estimates, but when these aren't available we extrapolate the previous free cash flow (FCF) from the last estimate or reported value. We assume companies with shrinking free cash flow will slow their rate of shrinkage, and that companies with growing free cash flow will see their growth rate slow, over this period. We do this to reflect that growth tends to slow more in the early years than it does in later years.
Generally we assume that a dollar today is more valuable than a dollar in the future, so we discount the value of these future cash flows to their estimated value in today's dollars:
10-year free cash flow (FCF) estimate
| 2025 | 2026 | 2027 | 2028 | 2029 | 2030 | 2031 | 2032 | 2033 | 2034 | |
| Levered FCF ($, Millions) | US$2.47b | US$2.70b | US$3.27b | US$3.92b | US$4.39b | US$4.79b | US$5.14b | US$5.44b | US$5.71b | US$5.96b |
| Growth Rate Estimate Source | Analyst x9 | Analyst x9 | Analyst x3 | Analyst x1 | Est @ 11.99% | Est @ 9.21% | Est @ 7.28% | Est @ 5.92% | Est @ 4.97% | Est @ 4.30% |
| Present Value ($, Millions) Discounted @ 7.9% | US$2.3k | US$2.3k | US$2.6k | US$2.9k | US$3.0k | US$3.0k | US$3.0k | US$3.0k | US$2.9k | US$2.8k |
("Est" = FCF growth rate estimated by Simply Wall St)
Present Value of 10-year Cash Flow (PVCF) = US$28b
We now need to calculate the Terminal Value, which accounts for all the future cash flows after this ten year period. For a number of reasons a very conservative growth rate is used that cannot exceed that of a country's GDP growth. In this case we have used the 5-year average of the 10-year government bond yield (2.8%) to estimate future growth. In the same way as with the 10-year 'growth' period, we discount future cash flows to today's value, using a cost of equity of 7.9%.
Terminal Value (TV)= FCF2034 × (1 + g) ÷ (r – g) = US$6.0b× (1 + 2.8%) ÷ (7.9%– 2.8%) = US$118b
Present Value of Terminal Value (PVTV)= TV / (1 + r)10= US$118b÷ ( 1 + 7.9%)10= US$55b
The total value is the sum of cash flows for the next ten years plus the discounted terminal value, which results in the Total Equity Value, which in this case is US$83b. The last step is to then divide the equity value by the number of shares outstanding. Relative to the current share price of US$577, the company appears a touch undervalued at a 25% discount to where the stock price trades currently. The assumptions in any calculation have a big impact on the valuation, so it is better to view this as a rough estimate, not precise down to the last cent.
The Assumptions
The calculation above is very dependent on two assumptions. The first is the discount rate and the other is the cash flows. You don't have to agree with these inputs, I recommend redoing the calculations yourself and playing with them. The DCF also does not consider the possible cyclicality of an industry, or a company's future capital requirements, so it does not give a full picture of a company's potential performance. Given that we are looking at Roper Technologies as potential shareholders, the cost of equity is used as the discount rate, rather than the cost of capital (or weighted average cost of capital, WACC) which accounts for debt. In this calculation we've used 7.9%, which is based on a levered beta of 1.199. Beta is a measure of a stock's volatility, compared to the market as a whole. We get our beta from the industry average beta of globally comparable companies, with an imposed limit between 0.8 and 2.0, which is a reasonable range for a stable business.
View our latest analysis for Roper Technologies
SWOT Analysis for Roper Technologies
Strength
- Debt is not viewed as a risk.
Weakness
- Earnings growth over the past year underperformed the Software industry.
- Dividend is low compared to the top 25% of dividend payers in the Software market.
Opportunity
- Annual earnings are forecast to grow for the next 3 years.
- Trading below our estimate of fair value by more than 20%.
Threat
- Annual earnings are forecast to grow slower than the American market.
Looking Ahead:
Whilst important, the DCF calculation ideally won't be the sole piece of analysis you scrutinize for a company. The DCF model is not a perfect stock valuation tool. Rather it should be seen as a guide to "what assumptions need to be true for this stock to be under/overvalued?" For instance, if the terminal value growth rate is adjusted slightly, it can dramatically alter the overall result. What is the reason for the share price sitting below the intrinsic value? For Roper Technologies, there are three fundamental factors you should assess:
- Financial Health: Does ROP have a healthy balance sheet? Take a look at our free balance sheet analysis with six simple checks on key factors like leverage and risk.
- Future Earnings: How does ROP's growth rate compare to its peers and the wider market? Dig deeper into the analyst consensus number for the upcoming years by interacting with our free analyst growth expectation chart.
- Other High Quality Alternatives: Do you like a good all-rounder? Explore our interactive list of high quality stocks to get an idea of what else is out there you may be missing!
PS. Simply Wall St updates its DCF calculation for every American stock every day, so if you want to find the intrinsic value of any other stock just search here.
New: AI Stock Screener & Alerts
Our new AI Stock Screener scans the market every day to uncover opportunities.
• Dividend Powerhouses (3%+ Yield)
• Undervalued Small Caps with Insider Buying
• High growth Tech and AI Companies
Or build your own from over 50 metrics.
Have feedback on this article? Concerned about the content? Get in touch with us directly. Alternatively, email editorial-team (at) simplywallst.com.
This article by Simply Wall St is general in nature. We provide commentary based on historical data and analyst forecasts only using an unbiased methodology and our articles are not intended to be financial advice. It does not constitute a recommendation to buy or sell any stock, and does not take account of your objectives, or your financial situation. We aim to bring you long-term focused analysis driven by fundamental data. Note that our analysis may not factor in the latest price-sensitive company announcements or qualitative material. Simply Wall St has no position in any stocks mentioned.
About NasdaqGS:ROP
Roper Technologies
Designs and develops vertical software and technology enabled products in the United States, Canada, Europe, Asia, and internationally.
Very undervalued with proven track record and pays a dividend.
Similar Companies
Market Insights


Advertisement
Weekly Picks
LO


Lou_Basenese on Cue Biopharma ·
Cue Biopharma (NASDAQ: CUE): The Scientist Behind Xolair Just Gave Cue a Next-Generation Shot at the Same Multi-Billion-Dollar Market
Fair Value:US$7058.5% undervalued
21 followersusers have followed this narrative
0 commentsusers have commented on this narrative
5 likesusers have liked this narrative
HE


HedgeY on AST SpaceMobile ·
AST SpaceMobile: The Boldest Direct-to-Cell Bet in Public Markets
Fair Value:US$17045.8% undervalued
43 followersusers have followed this narrative
0 commentsusers have commented on this narrative
13 likesusers have liked this narrative
FU

FundamentalFlow on Onto Innovation ·
Onto Innovation: The Advanced Packaging Chokepoint 51.3% undervalued intrinsic discount
Fair Value:US$38029.2% undervalued
26 followersusers have followed this narrative
0 commentsusers have commented on this narrative
8 likesusers have liked this narrative
MA


martinarauz on Nu Holdings ·
Investment Analysis (May 2026)
Fair Value:US$22.7449.0% undervalued
58 followersusers have followed this narrative
0 commentsusers have commented on this narrative
15 likesusers have liked this narrative
Recently Updated Narratives
RE

REElax on Volta Metals ·
Springer REE deposit valuation
Fair Value:CA$3.595.0% undervalued
6 followersusers have followed this narrative
0 commentsusers have commented on this narrative
0 likesusers have liked this narrative
DA


davidlsander on Atlas Salt ·
Once In A Life Time Deeply Discounted Recession Proof Utility
Fair Value:CA$2.9656.8% undervalued
1 followerusers have followed this narrative
0 commentsusers have commented on this narrative
0 likesusers have liked this narrative
PI


PittTheYounger on SSAB ·
SSAB in pole position when it comes to the combination of steel tariffs and the EU's investment drive
Fair Value:SEK 79.1721.8% overvalued
63 followersusers have followed this narrative
3 commentsusers have commented on this narrative
0 likesusers have liked this narrative
Popular Narratives
MA
martinarauz on Nu Holdings ·
Investment Analysis (May 2026)
Fair Value:US$22.7449.0% undervalued
58 followersusers have followed this narrative
0 commentsusers have commented on this narrative
15 likesusers have liked this narrative
CL


Clive_Thompson on Take-Two Interactive Software ·
Take-Two Interactive: The Calm Before the Storm NASDAQ: TTWO Last Price: $242.41 Date: May 15, 2026
Fair Value:US$276.9723.3% undervalued
57 followersusers have followed this narrative
0 commentsusers have commented on this narrative
14 likesusers have liked this narrative
NI


niteco on Honeywell International ·
Honeywell - The Demand-Side of the AI Infrastructure
Fair Value:US$320.1933.9% undervalued
48 followersusers have followed this narrative
0 commentsusers have commented on this narrative
19 likesusers have liked this narrative
Trending Discussion
KA


Karndog on Berkshire Hathaway ·
Abel is also an Energy expert. He's already on the AI train even without "buying tech".
0
|0
SI

Simply Wall St User on Automatic Data Processing ·
This stock with dividend Aristocrat status and real annual increases may require more time to ascert...
0
|0
SI

Simply Wall St User on Access Holdings ·
It's wonderful. It has greatly helped me take informed decisions.
0
|0