Advertisement
- United States
- /
- Software
- /
- NasdaqGS:RDWR
Assessing Radware (RDWR) Valuation Following Latest Financial Results

Simply Wall St
Reviewed by Kshitija Bhandaru
Radware (RDWR) shares recently caught investor attention following the company’s release of its latest financial results. The market’s response has been steady so far, with traders analyzing how these numbers may influence future growth prospects.
See our latest analysis for Radware.
Although Radware’s daily and monthly share price returns were modest, long-term investors have seen a steady climb, with a total shareholder return of 21% over the past year. This suggests cautious optimism from the market, supported by the company’s recent financial disclosures and ongoing focus on growth opportunities.
If you’re looking to broaden your investment search, now’s a solid time to discover fast growing stocks with high insider ownership.
With Radware trading below analyst targets and showing steady annual revenue growth, investors are left wondering if the market is underestimating its future potential, or if the current price is already factoring in what’s ahead.
Price-to-Earnings of 82.1x: Is it justified?
Radware is currently trading at a price-to-earnings (P/E) ratio of 82.1x, which is notably higher than both its direct peers and the broader US software industry. At its last close of $27.25, this valuation raises questions about whether the share price truly reflects expected profitability and growth rates.
The P/E ratio is a standard metric used by investors to compare a company's current share price to its per-share earnings. For software firms, this figure can indicate how much investors are willing to pay for a dollar of earnings and often reflects future growth expectations as well as sector dynamics.
Radware’s elevated P/E suggests that the market is placing a premium on its future earnings potential, perhaps in anticipation of significant profit growth or strategic milestones. However, its P/E of 82.1x stands well above the peer average of 24.5x and also eclipses the US software industry’s average of 35.5x. This makes the current valuation difficult to justify solely based on current fundamentals.
Without a reliable fair ratio to anchor expectations, the present multiple signals that the market is pricing in quite a bit of optimism. This positions Radware’s valuation at a distinct premium and the market could adjust toward a different level should growth not materialize as anticipated.
See what the numbers say about this price — find out in our valuation breakdown.
Result: Price-to-Earnings of 82.1x (OVERVALUED)
However, economic headwinds or weaker-than-expected revenue growth could challenge the optimistic outlook that is currently priced into Radware’s shares.
Find out about the key risks to this Radware narrative.
Another View: Discounted Cash Flow Analysis
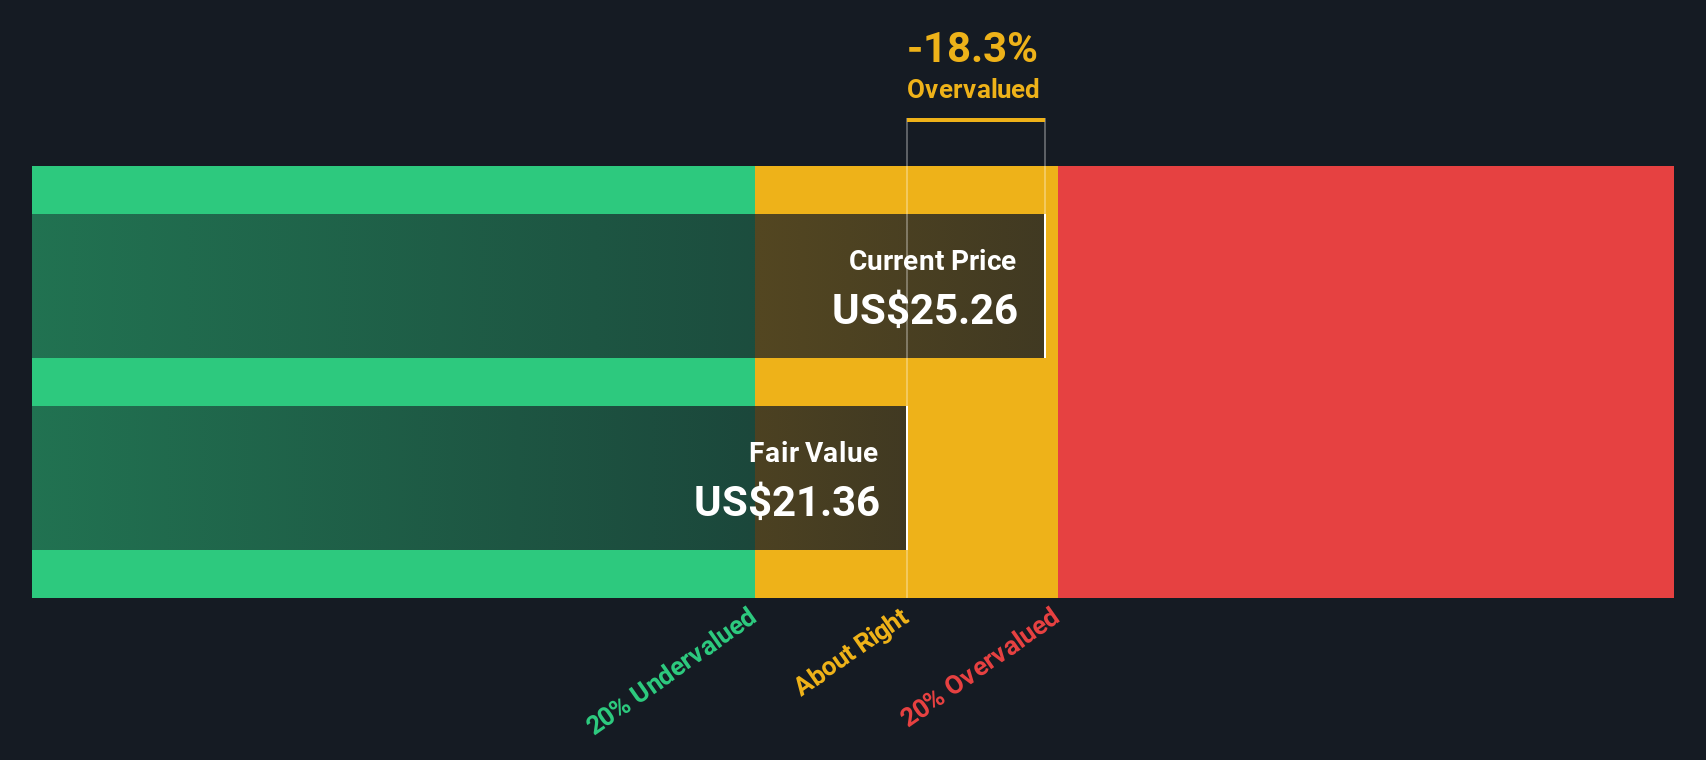
Looking beyond P/E ratios, our DCF model suggests Radware’s $27.25 share price is significantly higher than what is estimated as fair value, which is $21.21. This method signals the stock could be overvalued based on future cash flows. Does this challenge the case made by high earnings multiples?
Look into how the SWS DCF model arrives at its fair value.
Simply Wall St performs a discounted cash flow (DCF) on every stock in the world every day (check out Radware for example). We show the entire calculation in full. You can track the result in your watchlist or portfolio and be alerted when this changes, or use our stock screener to discover undervalued stocks based on their cash flows. If you save a screener we even alert you when new companies match - so you never miss a potential opportunity.
Build Your Own Radware Narrative
If you’d like to draw your own conclusions or take a hands-on approach, crafting an independent view only takes a few minutes. Do it your way.
A great starting point for your Radware research is our analysis highlighting 1 key reward and 2 important warning signs that could impact your investment decision.
Looking for more investment ideas?
Smart investors never settle for the usual picks. Expand your portfolio by targeting hidden growth stories and strong business models you might otherwise overlook.
- Capitalize on untapped value by targeting these 914 undervalued stocks based on cash flows, which could be set for a turnaround as the market catches on.
- Collect steady income from these 19 dividend stocks with yields > 3% offering attractive yields above 3 percent, a strategy that is well-suited for building wealth with staying power.
- Ride the rising wave of innovation and explore how your capital could surge with these 23 AI penny stocks reshaping tomorrow’s world.
This article by Simply Wall St is general in nature. We provide commentary based on historical data and analyst forecasts only using an unbiased methodology and our articles are not intended to be financial advice. It does not constitute a recommendation to buy or sell any stock, and does not take account of your objectives, or your financial situation. We aim to bring you long-term focused analysis driven by fundamental data. Note that our analysis may not factor in the latest price-sensitive company announcements or qualitative material. Simply Wall St has no position in any stocks mentioned.
New: AI Stock Screener & Alerts
Our new AI Stock Screener scans the market every day to uncover opportunities.
• Dividend Powerhouses (3%+ Yield)
• Undervalued Small Caps with Insider Buying
• High growth Tech and AI Companies
Or build your own from over 50 metrics.
Have feedback on this article? Concerned about the content? Get in touch with us directly. Alternatively, email editorial-team@simplywallst.com
About NasdaqGS:RDWR
Radware
Develops, manufactures, and markets cyber security and application delivery solutions for cloud, on-premises, and software defined data canters.
Flawless balance sheet with very low risk.
Similar Companies
Market Insights

Advertisement
Community Narratives
The Next Phase of Energy Storage: How NeoVolta Is Tackling America’s Power Crunch
Fair Value US$7.50|35.2% undervalued
MA
Community Contributor
Why EnSilica is Worth Possibly 13x its Current Price
Fair Value UK£5.00|90.0% undervalued
DO
Community Contributor
M&A Activity, Industry Diversification & A Defense Contract Monopoly Will Push BWXT For Healthy Long-Term Growth
Fair Value US$220.00|15.6% undervalued
CL
Community Contributor
A case for Cassiar Gold Corp (TSXV: GLDC) to reach CAD$8-10 before 2030 (X30-37)
Fair Value CA$10.00|97.1% undervalued
AG
Community Contributor