Advertisement
- United States
- /
- Software
- /
- NasdaqGS:MANH
Is Manhattan Associates Set for a Recovery After Its 30% Share Price Decline in 2024?

Simply Wall St
Reviewed by Bailey Pemberton
If you own or are weighing whether to invest in Manhattan Associates, you have likely noticed the rollercoaster the stock has been on lately. While just three years ago shares were up over 50%, the last twelve months have been rough with a 30.5% slide, bringing the year-to-date drop to 26%. Even shorter horizons show a dip, with a 2.9% fall in just the past week and a 7.6% decline over the last month. Despite this pullback, it is worth remembering that Manhattan Associates’ five-year return is still an impressive 91.2%, which is not a trivial showing.
What is behind these moves? Industry-wide shifts in supply chain technology and changing perceptions of risk have prompted investors to recalibrate, even though the company’s fundamental growth story remains largely intact. The result is a stock price that might seem to some as being hammered down, while others see it as simply normalizing after a strong multi-year run.
With all this in mind, the big question is whether Manhattan Associates is undervalued or if the recent correction better aligns the price with its actual prospects. According to a well-known valuation scoring system, Manhattan Associates earns a score of just 1 out of 6 checks, suggesting pockets of value may exist, but not across the board.
Up next, we will break down the main valuation frameworks used by analysts. Each framework may tell a different part of the story. For those who want to see beyond the numbers, we will finish by discussing a more complete way to assess whether the stock is a smart buy or not.
Manhattan Associates scores just 1/6 on our valuation checks. See what other red flags we found in the full valuation breakdown.
Approach 1: Manhattan Associates Discounted Cash Flow (DCF) Analysis
A Discounted Cash Flow (DCF) model estimates a company's intrinsic value by forecasting its future cash flows and discounting them back to today’s value. This method highlights how much cash a business is expected to generate in the future. For Manhattan Associates, this approach focuses on current and projected Free Cash Flow (FCF), along with expert growth expectations.
Currently, Manhattan Associates has a Free Cash Flow of $308 million. Analyst consensus projects steady growth, with FCF estimates reaching $665.9 million by the end of 2029. Beyond the next five years, forecasts are extended using industry models rather than direct analyst predictions. For the near term, expert input remains strong.
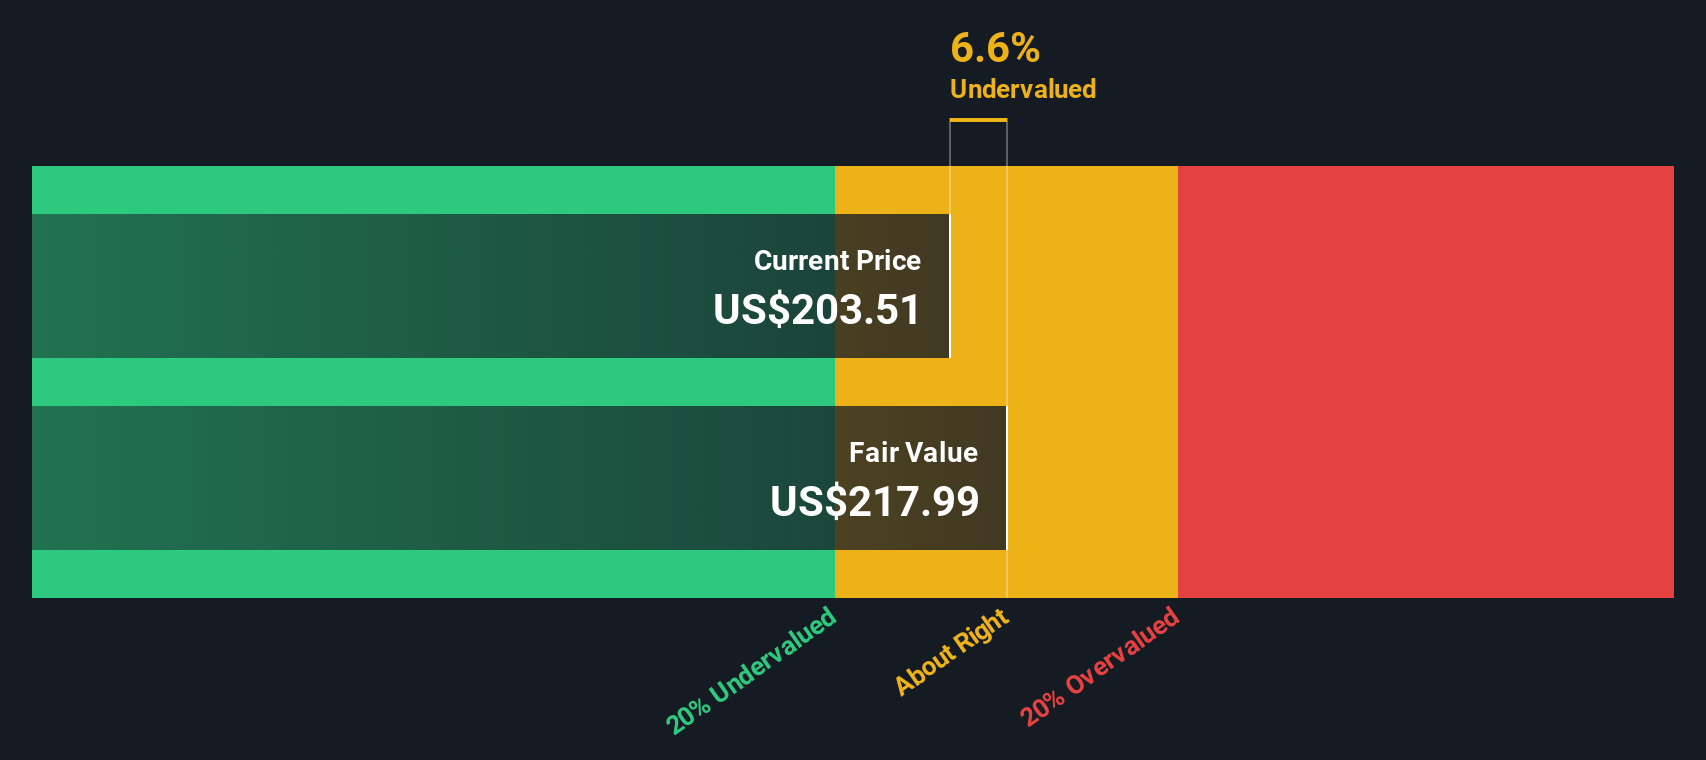
According to the DCF model, the intrinsic value of Manhattan Associates shares is calculated as $218.50. This result indicates the stock is trading at an 8.9% discount relative to its underlying cash flow potential. The DCF outcome suggests that while the shares appear modestly undervalued, the margin is not large enough for a truly decisive call.
Result: ABOUT RIGHT
Simply Wall St performs a valuation analysis on every stock in the world every day (check out Manhattan Associates's valuation analysis). We show the entire calculation in full. You can track the result in your watchlist or portfolio and be alerted when this changes.
Approach 2: Manhattan Associates Price vs Earnings
The Price-to-Earnings (PE) ratio is the preferred valuation metric for profitable companies like Manhattan Associates because it provides a straightforward way to gauge how much investors are willing to pay for each dollar of earnings. The PE ratio reflects market expectations about growth and risk. Companies with solid growth prospects or lower risks tend to trade at a higher PE, while cyclical or riskier firms usually have lower ratios.
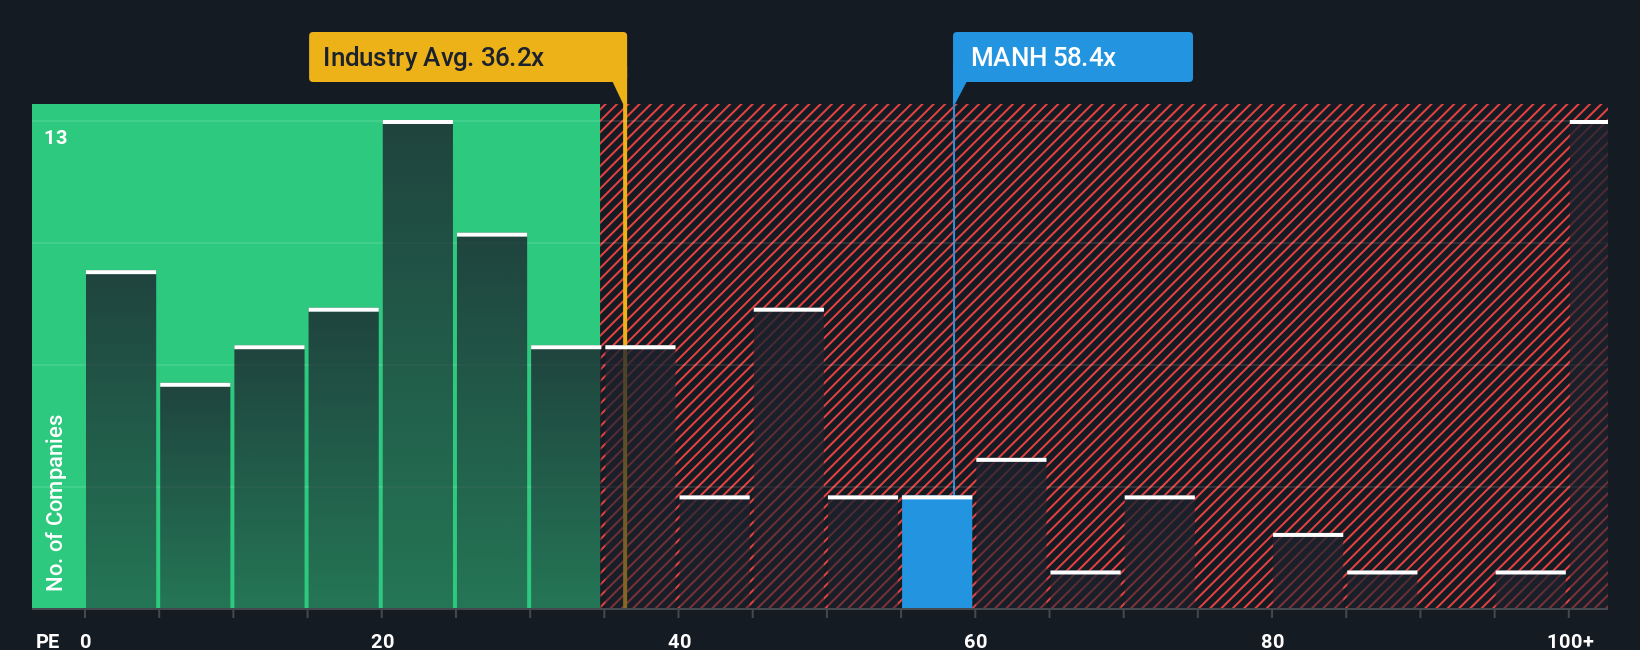
Manhattan Associates currently trades at a PE ratio of 54.4x. For perspective, the software industry average is 35.6x, and the peer group average stands at 36.0x. By those measures alone, Manhattan appears pricey. However, what is “fair” can differ dramatically based on each company’s specific growth trajectory, profitability, market cap, and risk factors.
This is where Simply Wall St's “Fair Ratio” comes in. Unlike a simple peer or industry comparison, the Fair Ratio adjusts for the company’s earnings growth outlook, profit margins, market cap, and unique risk profile, giving a more tailored benchmark. For Manhattan Associates, the Fair Ratio is calculated as 32.4x, reflecting all these company-specific factors.
Comparing the actual PE of 54.4x to the Fair Ratio of 32.4x suggests Manhattan Associates is trading at a premium to what its fundamentals would warrant. That means investors are currently paying significantly more than the calculated “fair” value for each dollar of earnings.
Result: OVERVALUED
PE ratios tell one story, but what if the real opportunity lies elsewhere? Discover companies where insiders are betting big on explosive growth.
Upgrade Your Decision Making: Choose your Manhattan Associates Narrative
Earlier we mentioned there is an even better way to understand valuation, so let’s introduce you to Narratives. A Narrative is your unique story behind the numbers, where you define what you believe about a company’s future growth, margins, and fair value based on the trends, catalysts, and risks you see.
Narratives empower you to connect the dots between a company’s outlook, your own financial forecasts, and what you see as a fair share price. This approach makes investment decisions more meaningful and informed than simply looking at checklist ratios. They are simple to create and explore on Simply Wall St’s Community page, where millions of investors share and update their outlooks dynamically as news and earnings reports roll in.
By comparing your Narrative’s Fair Value with the current share price, you can quickly sense whether the stock looks attractive to buy, hold, or sell, while understanding the reasons behind every viewpoint. For example, some users see Manhattan Associates as worth $250 and highlight rapid cloud adoption and market expansion, while others are more cautious with a $205 target due to risks from slow migration or intense competition.
Do you think there's more to the story for Manhattan Associates? Create your own Narrative to let the Community know!

This article by Simply Wall St is general in nature. We provide commentary based on historical data and analyst forecasts only using an unbiased methodology and our articles are not intended to be financial advice. It does not constitute a recommendation to buy or sell any stock, and does not take account of your objectives, or your financial situation. We aim to bring you long-term focused analysis driven by fundamental data. Note that our analysis may not factor in the latest price-sensitive company announcements or qualitative material. Simply Wall St has no position in any stocks mentioned.
New: Manage All Your Stock Portfolios in One Place
We've created the ultimate portfolio companion for stock investors, and it's free.
• Connect an unlimited number of Portfolios and see your total in one currency
• Be alerted to new Warning Signs or Risks via email or mobile
• Track the Fair Value of your stocks
Have feedback on this article? Concerned about the content? Get in touch with us directly. Alternatively, email editorial-team@simplywallst.com
About NasdaqGS:MANH
Manhattan Associates
Develops, sells, deploys, services, and maintains software solutions to manage supply chains, inventory, and omni-channel operations.
Flawless balance sheet and fair value.
Similar Companies
Market Insights

Advertisement
Community Narratives
MicroVision will explode future revenue by 380.37% with a vision towards success
Fair Value US$60|98.4% undervalued
TH
Community Contributor
The Indispensable Artery for a New North American Economy
Fair Value CA$132.87|0.7% overvalued
TI
Community Contributor
Recently Updated Narratives
CO

composite32 on Astor Enerji ·
Astor Enerji will surge with a fair value of $140.43 in the next 3 years
Fair Value:₺140.4335.5% undervalued
1 followerusers have followed this narrative
0 commentsusers have commented on this narrative
0 likesusers have liked this narrative
RE

RecMag on Proximus ·
Proximus: The State-Backed Backup Plan with 7% Gross Yield and 15% Currency Upside.
Fair Value:€17.1356.7% undervalued
30 followersusers have followed this narrative
0 commentsusers have commented on this narrative
0 likesusers have liked this narrative
AG


Agricola on IMPACT Silver ·
A case for for IMPACT Silver Corp (TSXV:IPT) to reach USD $4.52 (CAD $6.16) in 2026 (23 bagger in 1 year) and USD $5.76 (CAD $7.89) by 2030
Fair Value:CA$7.8996.2% undervalued
1 followerusers have followed this narrative
0 commentsusers have commented on this narrative
0 likesusers have liked this narrative
Popular Narratives
TH

TheWallstreetKing on MicroVision ·
MicroVision will explode future revenue by 380.37% with a vision towards success
Fair Value:US$6098.4% undervalued
101 followersusers have followed this narrative
10 commentsusers have commented on this narrative
20 likesusers have liked this narrative
OS


oscargarcia on Alphabet ·
The company that turned a verb into a global necessity and basically runs the modern internet, digital ads, smartphones, maps, and AI.
Fair Value:US$3405.8% undervalued
138 followersusers have followed this narrative
6 commentsusers have commented on this narrative
18 likesusers have liked this narrative
AN


AnalystConsensusTarget on NVIDIA ·
NVDA: Expanding AI Demand Will Drive Major Data Center Investments Through 2026
Fair Value:US$250.3929.3% undervalued
930 followersusers have followed this narrative
6 commentsusers have commented on this narrative
23 likesusers have liked this narrative