
Advertisement
- United States
- /
- Software
- /
- NasdaqGS:EXFY
Revenues Working Against Expensify, Inc.'s (NASDAQ:EXFY) Share Price Following 26% Dive
To the annoyance of some shareholders, Expensify, Inc. (NASDAQ:EXFY) shares are down a considerable 26% in the last month, which continues a horrid run for the company. Looking at the bigger picture, even after this poor month the stock is up 30% in the last year.
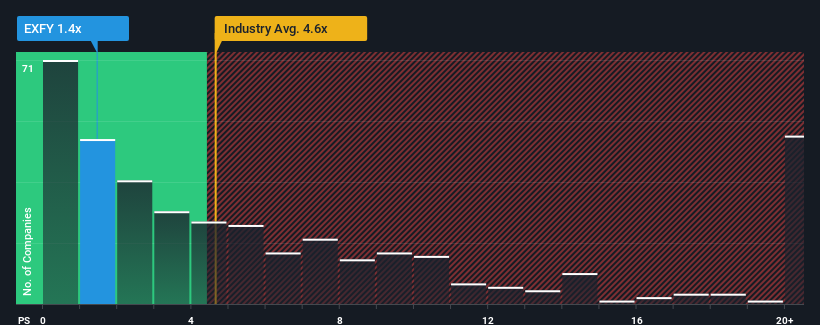
Following the heavy fall in price, Expensify's price-to-sales (or "P/S") ratio of 1.4x might make it look like a strong buy right now compared to the wider Software industry in the United States, where around half of the companies have P/S ratios above 4.6x and even P/S above 10x are quite common. Nonetheless, we'd need to dig a little deeper to determine if there is a rational basis for the highly reduced P/S.
Our free stock report includes 2 warning signs investors should be aware of before investing in Expensify. Read for free now.View our latest analysis for Expensify
How Has Expensify Performed Recently?
Expensify hasn't been tracking well recently as its declining revenue compares poorly to other companies, which have seen some growth in their revenues on average. Perhaps the P/S remains low as investors think the prospects of strong revenue growth aren't on the horizon. So while you could say the stock is cheap, investors will be looking for improvement before they see it as good value.
Keen to find out how analysts think Expensify's future stacks up against the industry? In that case, our free report is a great place to start.Is There Any Revenue Growth Forecasted For Expensify?
In order to justify its P/S ratio, Expensify would need to produce anemic growth that's substantially trailing the industry.
Taking a look back first, the company's revenue growth last year wasn't something to get excited about as it posted a disappointing decline of 1.6%. As a result, revenue from three years ago have also fallen 7.6% overall. Accordingly, shareholders would have felt downbeat about the medium-term rates of revenue growth.
Shifting to the future, estimates from the five analysts covering the company suggest revenue should grow by 4.8% over the next year. With the industry predicted to deliver 15% growth, the company is positioned for a weaker revenue result.
With this information, we can see why Expensify is trading at a P/S lower than the industry. It seems most investors are expecting to see limited future growth and are only willing to pay a reduced amount for the stock.
The Final Word
Having almost fallen off a cliff, Expensify's share price has pulled its P/S way down as well. Using the price-to-sales ratio alone to determine if you should sell your stock isn't sensible, however it can be a practical guide to the company's future prospects.
We've established that Expensify maintains its low P/S on the weakness of its forecast growth being lower than the wider industry, as expected. At this stage investors feel the potential for an improvement in revenue isn't great enough to justify a higher P/S ratio. It's hard to see the share price rising strongly in the near future under these circumstances.
Plus, you should also learn about these 2 warning signs we've spotted with Expensify.
If you're unsure about the strength of Expensify's business, why not explore our interactive list of stocks with solid business fundamentals for some other companies you may have missed.
Valuation is complex, but we're here to simplify it.
Discover if Expensify might be undervalued or overvalued with our detailed analysis, featuring fair value estimates, potential risks, dividends, insider trades, and its financial condition.
Access Free AnalysisHave feedback on this article? Concerned about the content? Get in touch with us directly. Alternatively, email editorial-team (at) simplywallst.com.
This article by Simply Wall St is general in nature. We provide commentary based on historical data and analyst forecasts only using an unbiased methodology and our articles are not intended to be financial advice. It does not constitute a recommendation to buy or sell any stock, and does not take account of your objectives, or your financial situation. We aim to bring you long-term focused analysis driven by fundamental data. Note that our analysis may not factor in the latest price-sensitive company announcements or qualitative material. Simply Wall St has no position in any stocks mentioned.
About NasdaqGS:EXFY
Expensify
Provides a cloud-based expense management software platform in the United States and internationally.
Flawless balance sheet and undervalued.
Similar Companies
Market Insights

Advertisement
Community Narratives
MicroVision will explode future revenue by 380.37% with a vision towards success
Fair Value US$60|98.4% undervalued
TH
Community Contributor
The Indispensable Artery for a New North American Economy
Fair Value CA$132.87|0.8% undervalued
TI
Community Contributor
Recently Updated Narratives
RE

RecMag on Proximus ·
Proximus: The State-Backed Backup Plan with 7% Gross Yield and 15% Currency Upside.
Fair Value:€17.1356.7% undervalued
29 followersusers have followed this narrative
0 commentsusers have commented on this narrative
0 likesusers have liked this narrative
SW

swift11 on DXC Technology ·
CEO: We are winners in the long term in the AI world
Fair Value:US$17.4624.9% undervalued
1 followerusers have followed this narrative
0 commentsusers have commented on this narrative
0 likesusers have liked this narrative
AL

AlexLovell on Rocket Lab ·
Early mover in a fast growing industry. Likely to experience share price volatility as they scale
Fair Value:US$16.25158.0% overvalued
2 followersusers have followed this narrative
0 commentsusers have commented on this narrative
0 likesusers have liked this narrative
Popular Narratives
TH

TheWallstreetKing on MicroVision ·
MicroVision will explode future revenue by 380.37% with a vision towards success
Fair Value:US$6098.4% undervalued
101 followersusers have followed this narrative
10 commentsusers have commented on this narrative
20 likesusers have liked this narrative
OS


oscargarcia on Alphabet ·
The company that turned a verb into a global necessity and basically runs the modern internet, digital ads, smartphones, maps, and AI.
Fair Value:US$3405.9% undervalued
137 followersusers have followed this narrative
6 commentsusers have commented on this narrative
18 likesusers have liked this narrative
AN


AnalystConsensusTarget on NVIDIA ·
NVDA: Expanding AI Demand Will Drive Major Data Center Investments Through 2026
Fair Value:US$232.7922.6% undervalued
929 followersusers have followed this narrative
6 commentsusers have commented on this narrative
22 likesusers have liked this narrative