
Advertisement
- United States
- /
- Software
- /
- NasdaqGS:ADBE
Adobe Inc.'s (NASDAQ:ADBE) P/E Still Appears To Be Reasonable
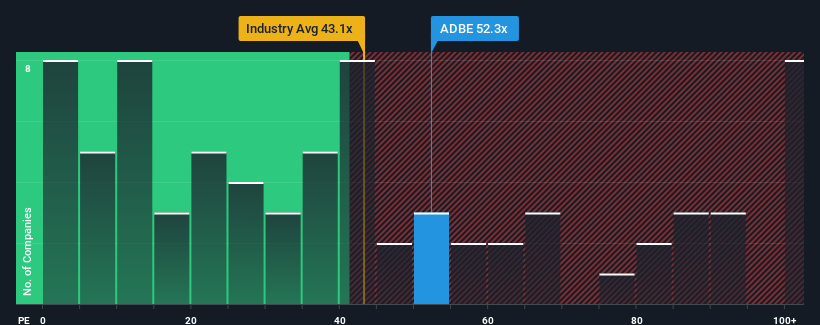
With a price-to-earnings (or "P/E") ratio of 52.3x Adobe Inc. (NASDAQ:ADBE) may be sending very bearish signals at the moment, given that almost half of all companies in the United States have P/E ratios under 16x and even P/E's lower than 9x are not unusual. However, the P/E might be quite high for a reason and it requires further investigation to determine if it's justified.
Adobe certainly has been doing a good job lately as its earnings growth has been positive while most other companies have been seeing their earnings go backwards. It seems that many are expecting the company to continue defying the broader market adversity, which has increased investors’ willingness to pay up for the stock. You'd really hope so, otherwise you're paying a pretty hefty price for no particular reason.
View our latest analysis for Adobe
What Are Growth Metrics Telling Us About The High P/E?
There's an inherent assumption that a company should far outperform the market for P/E ratios like Adobe's to be considered reasonable.
If we review the last year of earnings growth, the company posted a terrific increase of 17%. The latest three year period has also seen a 9.8% overall rise in EPS, aided extensively by its short-term performance. Therefore, it's fair to say the earnings growth recently has been respectable for the company.
Turning to the outlook, the next three years should generate growth of 15% per annum as estimated by the analysts watching the company. That's shaping up to be materially higher than the 12% per year growth forecast for the broader market.
In light of this, it's understandable that Adobe's P/E sits above the majority of other companies. Apparently shareholders aren't keen to offload something that is potentially eyeing a more prosperous future.
The Key Takeaway
We'd say the price-to-earnings ratio's power isn't primarily as a valuation instrument but rather to gauge current investor sentiment and future expectations.
We've established that Adobe maintains its high P/E on the strength of its forecast growth being higher than the wider market, as expected. At this stage investors feel the potential for a deterioration in earnings isn't great enough to justify a lower P/E ratio. It's hard to see the share price falling strongly in the near future under these circumstances.
It is also worth noting that we have found 1 warning sign for Adobe that you need to take into consideration.
You might be able to find a better investment than Adobe. If you want a selection of possible candidates, check out this free list of interesting companies that trade on a low P/E (but have proven they can grow earnings).
New: Manage All Your Stock Portfolios in One Place
We've created the ultimate portfolio companion for stock investors, and it's free.
• Connect an unlimited number of Portfolios and see your total in one currency
• Be alerted to new Warning Signs or Risks via email or mobile
• Track the Fair Value of your stocks
Have feedback on this article? Concerned about the content? Get in touch with us directly. Alternatively, email editorial-team (at) simplywallst.com.
This article by Simply Wall St is general in nature. We provide commentary based on historical data and analyst forecasts only using an unbiased methodology and our articles are not intended to be financial advice. It does not constitute a recommendation to buy or sell any stock, and does not take account of your objectives, or your financial situation. We aim to bring you long-term focused analysis driven by fundamental data. Note that our analysis may not factor in the latest price-sensitive company announcements or qualitative material. Simply Wall St has no position in any stocks mentioned.
MI

The Foxhole
The world's in stitches over robots sprinting into walls. I still think they're the answer to our productivity problem.
87
DE
devon_jd150
What you have missed is that this event happened last year too. Last year the number was 21 seconds. This year it beat Bolt. That's 60% improvement in an year. Now extrapolate this in many axes of work that Robots can come and fill in. The physical productivity and AI boom is just starting.
LE
LeverageIsLovely
I can't pick a company. But I can pick a person. With no doubt that's Musk. Optimus for blue collar productivity increase and xAI for white collar productivity increase. Did anyone dabble with GrokBot here?
 Andrew Legget
Market Insights
Great earnings season, but are the earnings real?

At first glance, this was the strongest earnings season in years. But when you look at where the growth actually came from, the story splits into two very different pictures.
75
About NasdaqGS:ADBE
Adobe
Operates as a technology company worldwide.
Undervalued with adequate balance sheet.
Similar Companies
Market Insights


Advertisement
Weekly Picks
LO


Lou_Basenese on Oncolytics Biotech ·
The Team Behind a $2 Billion Johnson & Johnson (JNJ) Deal Just Took Over This $105 Million Cancer Biotech
Fair Value:US$3.576.1% undervalued
43 followersusers have followed this narrative
0 commentsusers have commented on this narrative
12 likesusers have liked this narrative
TR


tripledub on Meta Platforms ·
The $135 Billion Bet That Should Make Every Shareholder Nervous
Fair Value:US$5862.4% undervalued
63 followersusers have followed this narrative
3 commentsusers have commented on this narrative
34 likesusers have liked this narrative
TA


Talos on Voyager Technologies ·
The "Landlord of Orbit" – A Deep Value Play Ahead of the Starlab Era
Fair Value:US$385.291.3% undervalued
68 followersusers have followed this narrative
0 commentsusers have commented on this narrative
6 likesusers have liked this narrative
IV

Ivoed on Uber Technologies ·
Uber’s Valuation Depends On Who Captures The Economics Of Driverless Rides
Fair Value:US$11634.8% undervalued
14 followersusers have followed this narrative
0 commentsusers have commented on this narrative
3 likesusers have liked this narrative
Recently Updated Narratives
LU


LunaRodas on Science Applications International ·
SAIC | Science Applications International: What They Said vs. What They Did
Fair Value:US$119.247.5% overvalued
1 followerusers have followed this narrative
0 commentsusers have commented on this narrative
0 likesusers have liked this narrative
AN

Anthony_Lee on Lotus Technology ·
Tech and Tradition: Lotus Technology’s Compound Formula in Luxury EVs
Fair Value:US$2.5354.2% undervalued
2 followersusers have followed this narrative
5 commentsusers have commented on this narrative
1 likeusers have liked this narrative
EP

Epstein_Research on Dryden Gold ·
Dryden Gold continues to expand & de-risk its flagship Gold Rock project!
Fair Value:CA$173.0% undervalued
1 followerusers have followed this narrative
0 commentsusers have commented on this narrative
0 likesusers have liked this narrative
Popular Narratives
OS


oscargarcia on NVIDIA ·
The company that went from selling GPUs to gamers to becoming the AI arms dealer of the 21st century.
Fair Value:US$28021.3% undervalued
369 followersusers have followed this narrative
9 commentsusers have commented on this narrative
16 likesusers have liked this narrative
CU

CubanEros on Microsoft ·
A wonderful business at reasonable price.
Fair Value:US$419.9120.8% overvalued
214 followersusers have followed this narrative
0 commentsusers have commented on this narrative
9 likesusers have liked this narrative
JO


John_Eric on MercadoLibre ·
MercadoLibre and the Spreadsheet Trick That Decides Everything
Fair Value:US$7.31k73.5% undervalued
125 followersusers have followed this narrative
3 commentsusers have commented on this narrative
18 likesusers have liked this narrative

