Advertisement
- United States
- /
- Semiconductors
- /
- NasdaqGS:TXN
What Do New US Chip Tariffs Mean for TI’s Stock Price in 2025?

Simply Wall St
Reviewed by Bailey Pemberton
Thinking about what to do with Texas Instruments stock right now? You are definitely not alone. After years of solid performance, this chipmaker is now in a spot where excitement, concern, and plenty of questions are swirling. Over the past year, the stock has slipped 13.8%, with a year-to-date drop of 8.2% and a recent 4.8% decline in just the last week. If you have watched the headlines roll by, this makes sense. Investors are sifting through big news about policies nudging chip production back to American soil, shifting global supply chains, and even the threat of new tariffs. These policy shifts could mean some bumpy roads ahead, but they might also lay the groundwork for fresh opportunities.
Of course, there is a silver lining when you zoom out. Over three and five years, Texas Instruments stock still shows gains at 26.6% and 29% respectively. So, are these short-term jitters a chance to get in, or a warning signal to stay put? One of the best places to start is with a clear-eyed look at valuation. On that front, Texas Instruments scores a 3 out of 6 in undervaluation checks. This is not stellar, but definitely not overvalued either. As we break down what that number actually means by looking at different valuation methods, keep in mind there is an even deeper way to judge if a stock truly offers value, which we will get to by the end of this article.
Why Texas Instruments is lagging behind its peers
Approach 1: Texas Instruments Discounted Cash Flow (DCF) Analysis
The Discounted Cash Flow (DCF) model estimates a company's intrinsic value by projecting its future cash flows and discounting them back to today's value. It is a way to determine what the business could be worth based on how much cash it is expected to generate in the years ahead.
For Texas Instruments, the most recent Free Cash Flow (FCF) stands at $1.89 Billion. Analysts estimate that by 2029, FCF could reach $9.99 Billion, with projections rising steadily each year. While analysts provide estimates for the next five years, projections beyond that point are based on extrapolations from Simply Wall St, resulting in continued growth through 2035, although at a slower pace.
After applying the DCF model to these projected cash flows, the intrinsic value per share is calculated at $138.11. This figure is 24.3% below the current share price, which suggests the stock is trading at a premium according to these cash flow forecasts.
Result: OVERVALUED
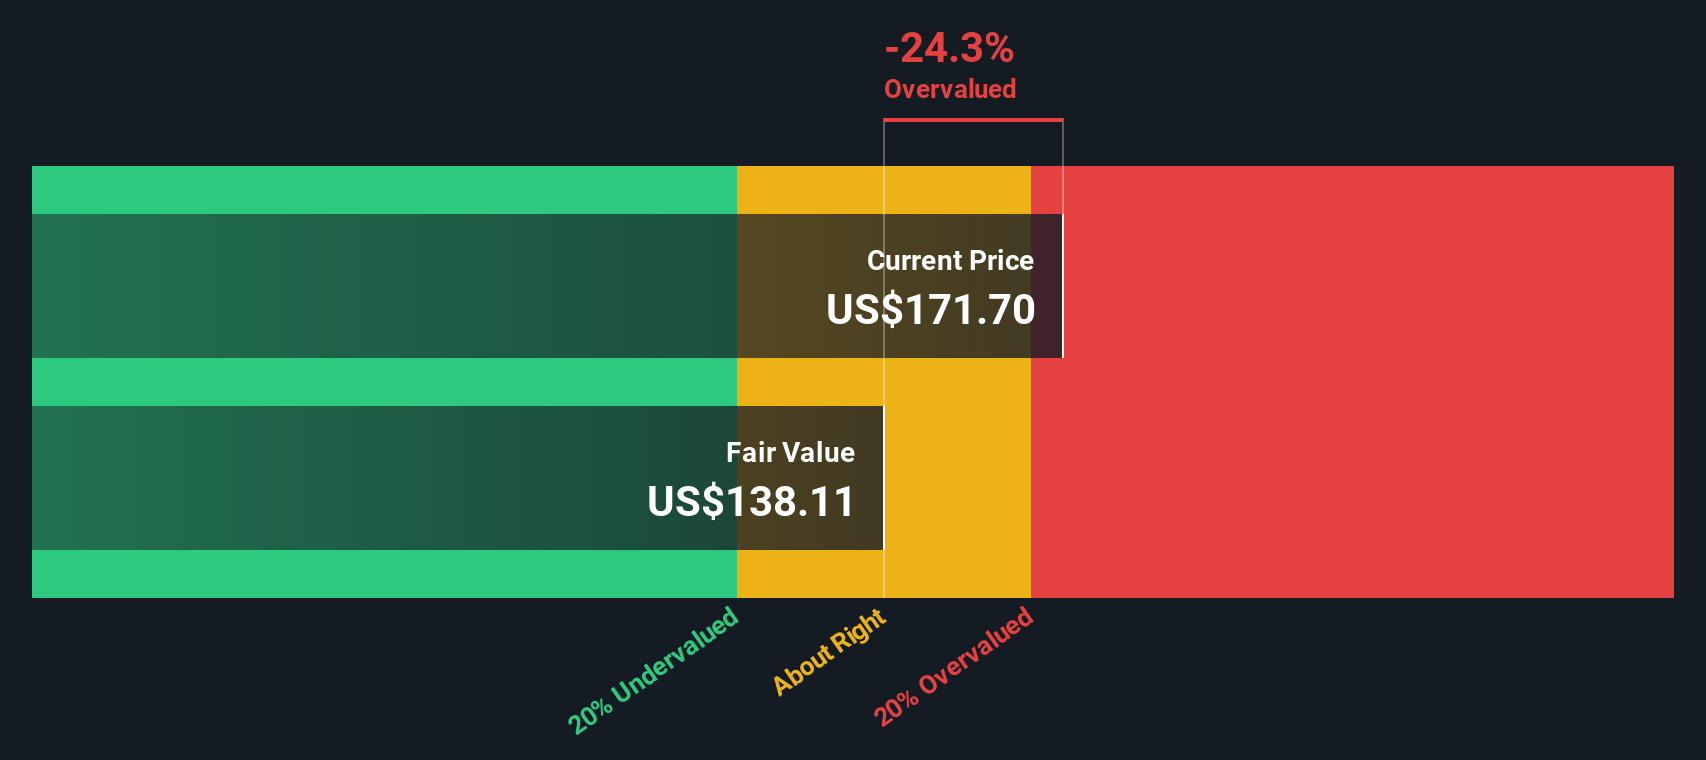
Our Discounted Cash Flow (DCF) analysis suggests Texas Instruments may be overvalued by 24.3%. Find undervalued stocks or create your own screener to find better value opportunities.
Approach 2: Texas Instruments Price vs Earnings
The Price-to-Earnings (PE) ratio is a popular way to value profitable companies like Texas Instruments because it directly compares a company's share price to its earnings, giving investors a simple snapshot of how the market values current profitability. Usually, a higher PE ratio can reflect optimism about future growth, while a lower one might signal lower growth expectations or higher risk. What is considered a “normal” PE ratio also depends on factors like earnings growth, profit margins, and the overall industry risk.
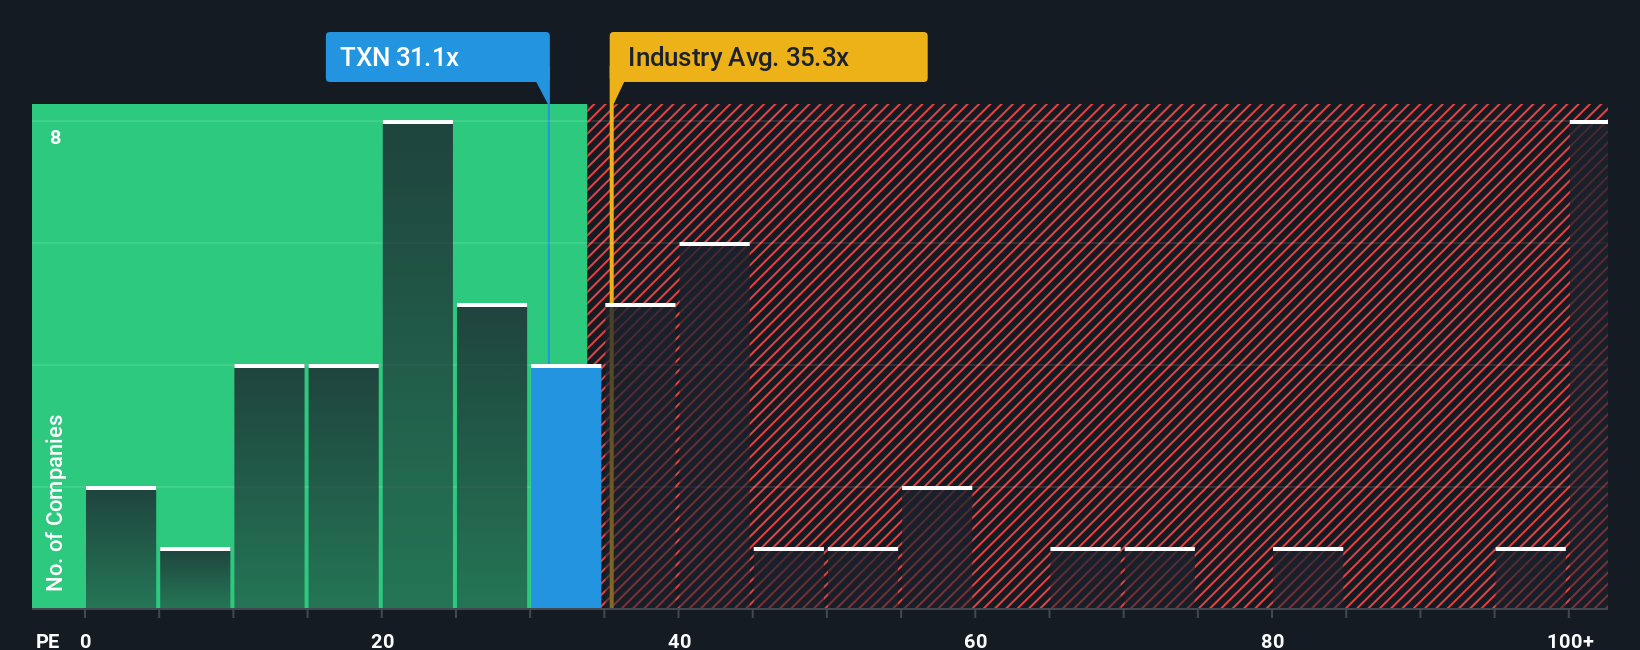
Right now, Texas Instruments trades at a PE of 31.1x, compared to the semiconductor industry average of 35.3x and a peer average of 55.6x. This means Texas Instruments is priced below both its industry and peer group, at least using this simple metric. However, looking just at the average can be misleading, since not all companies have the same growth prospects, risk profile, or profit margins.
This is where the Simply Wall St “Fair Ratio” comes into play. The Fair PE Ratio for Texas Instruments is calculated at 33.8x, which considers the company's own earnings growth, profit margins, market cap, risk factors, and its industry context. Unlike a straight comparison to peers or sector averages, the Fair Ratio adjusts for what actually matters for each company and provides a more nuanced view.
Comparing Texas Instruments’ actual PE of 31.1x with its Fair Ratio of 33.8x shows the stock is priced slightly below this tailored valuation, suggesting it is about right relative to the company's specific strengths and risks.
Result: ABOUT RIGHT
PE ratios tell one story, but what if the real opportunity lies elsewhere? Discover companies where insiders are betting big on explosive growth.
Upgrade Your Decision Making: Choose your Texas Instruments Narrative
Earlier we mentioned that there is an even better way to understand valuation, so let's introduce you to Narratives. A Narrative is a clear, personalized story that connects your view of Texas Instruments, including the drivers behind its future growth, risks, and market trends, to concrete forecasts and a calculated fair value.
By creating or exploring Narratives, you get to articulate how you think the company’s story unfolds and see the exact impact of your assumptions on future revenue, profit margins, and ultimately, what you believe is a fair price to pay for the stock. Narratives bridge the gap between financial models and real-world dynamics, making the investing process more grounded, intuitive, and relevant to your perspective.
This feature is easily accessible on Simply Wall St’s Community page, where millions of investors can create, share, and update their Narratives as new news or earnings reports come in. This keeps your valuation dynamic and reflective of the latest developments. Narratives enable you to confidently compare your Fair Value with the current share price and decide on your preferred action.
For example, one investor could see Texas Instruments as poised for impressive growth, resulting in a bullish Fair Value of $260.00, while another, more cautious about competition and macro risks, may land at a bearish $141.27. Narratives make these viewpoints explicit, trackable, and actionable.
For Texas Instruments, we’ll make it really easy for you with previews of two leading Texas Instruments Narratives:
Fair Value: $205.42
Undervalued by 16.4%
Expected revenue growth: 10.1%
- Industrial automation and automotive semiconductor demand is expected to drive resilient revenue and margin expansion, supported by a high-margin product focus.
- Domestic manufacturing investments and U.S. tax incentives are seen boosting supply chain resilience, strengthening cash flow, and supporting higher shareholder returns.
- Risks include increased competition, rapid technology shifts, and geopolitical uncertainty, which could impact margins, capacity utilization, and revenue stability in key end markets.
Fair Value: $141.27
Overvalued by 21.6%
Expected revenue growth: 6.5%
- Mounting competition, regulatory hurdles, and maturing core markets threaten Texas Instruments’ growth, margins, and operational efficiency.
- Rising regulatory compliance costs and capacity investments risk long-term margin compression and limited free cash flow.
- Despite domestic manufacturing expansion and favorable U.S. policy, the narrative expresses caution that market expectations remain too high given risks to demand and profitability.
Do you think there's more to the story for Texas Instruments? Create your own Narrative to let the Community know!
This article by Simply Wall St is general in nature. We provide commentary based on historical data and analyst forecasts only using an unbiased methodology and our articles are not intended to be financial advice. It does not constitute a recommendation to buy or sell any stock, and does not take account of your objectives, or your financial situation. We aim to bring you long-term focused analysis driven by fundamental data. Note that our analysis may not factor in the latest price-sensitive company announcements or qualitative material. Simply Wall St has no position in any stocks mentioned.
Valuation is complex, but we're here to simplify it.
Discover if Texas Instruments might be undervalued or overvalued with our detailed analysis, featuring fair value estimates, potential risks, dividends, insider trades, and its financial condition.
Access Free AnalysisHave feedback on this article? Concerned about the content? Get in touch with us directly. Alternatively, email editorial-team@simplywallst.com
About NasdaqGS:TXN
Texas Instruments
Designs, manufactures, and sells semiconductors to electronics designers and manufacturers in the United States, China, rest of Asia, Europe, Middle East, Africa, Japan, and internationally.
Acceptable track record with mediocre balance sheet.
Similar Companies
Market Insights

Advertisement
Weekly Picks
FA

FAI on Arabian Internet and Communication Services ·
Solutions by stc: 34% Upside in Saudi's Digital Transformation Leader
Fair Value:ر.س342.2335.3% undervalued
9 followersusers have followed this narrative
1 commentusers have commented on this narrative
3 likesusers have liked this narrative
RO


RobertoAllende on NVIDIA ·
The AI Infrastructure Giant Grows Into Its Valuation
Fair Value:US$345.0747.9% undervalued
27 followersusers have followed this narrative
28 commentsusers have commented on this narrative
21 likesusers have liked this narrative
Recently Updated Narratives
HA

Haha94 on Perdana Petroleum Berhad ·
Perdana Petroleum Berhad is a Zombie Business with a 27.34% Profit Margin and inflation adjusted revenue Business
Fair Value:RM 0.2128.6% undervalued
1 followerusers have followed this narrative
0 commentsusers have commented on this narrative
0 likesusers have liked this narrative
AB
Abc on Global X Etfs Icav - Global X Silver Miners Ucits ETF ·
Many trends acting at the same time
Fair Value:€10068.5% undervalued
1 followerusers have followed this narrative
0 commentsusers have commented on this narrative
0 likesusers have liked this narrative
NI


niteco on Texas Instruments ·
Engineered for Stability. Positioned for Growth.
Fair Value:US$314.4446.5% undervalued
2 followersusers have followed this narrative
0 commentsusers have commented on this narrative
0 likesusers have liked this narrative
Popular Narratives
TH

TheWallstreetKing on MicroVision ·
MicroVision will explode future revenue by 380.37% with a vision towards success
Fair Value:US$6098.6% undervalued
109 followersusers have followed this narrative
11 commentsusers have commented on this narrative
22 likesusers have liked this narrative
AN

AnalystConsensusTarget on NVIDIA ·
NVDA: Expanding AI Demand Will Drive Major Data Center Investments Through 2026
Fair Value:US$250.3928.1% undervalued
942 followersusers have followed this narrative
6 commentsusers have commented on this narrative
24 likesusers have liked this narrative
OS


oscargarcia on Alphabet ·
The company that turned a verb into a global necessity and basically runs the modern internet, digital ads, smartphones, maps, and AI.
Fair Value:US$3407.4% undervalued
145 followersusers have followed this narrative
6 commentsusers have commented on this narrative
18 likesusers have liked this narrative