
Advertisement
- United States
- /
- Semiconductors
- /
- NasdaqGS:SWKS
Skyworks Solutions' (NASDAQ:SWKS) 9.8% CAGR outpaced the company's earnings growth over the same five-year period

While Skyworks Solutions, Inc. (NASDAQ:SWKS) shareholders are probably generally happy, the stock hasn't had particularly good run recently, with the share price falling 10% in the last quarter. But at least the stock is up over the last five years. Unfortunately its return of 45% is below the market return of 86%. Unfortunately not all shareholders will have held it for five years, so spare a thought for those caught in the 35% decline over the last three years: that's a long time to wait for profits.
The past week has proven to be lucrative for Skyworks Solutions investors, so let's see if fundamentals drove the company's five-year performance.
Check out our latest analysis for Skyworks Solutions
There is no denying that markets are sometimes efficient, but prices do not always reflect underlying business performance. One imperfect but simple way to consider how the market perception of a company has shifted is to compare the change in the earnings per share (EPS) with the share price movement.
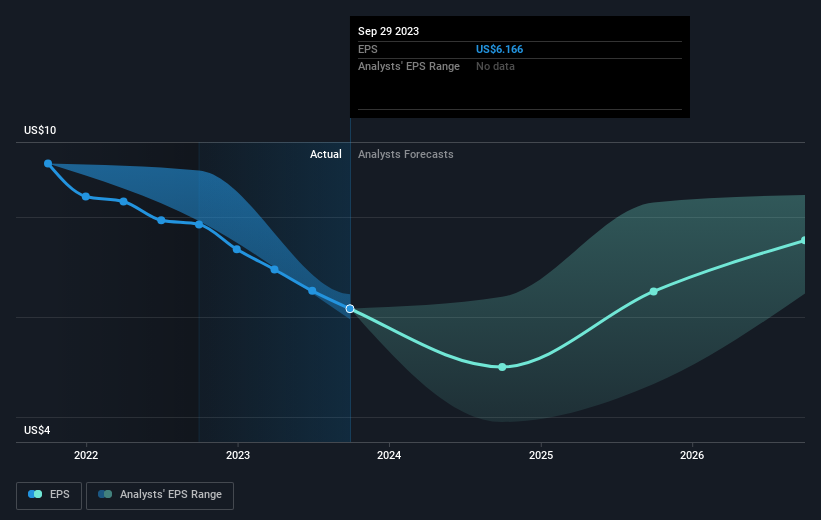
Over half a decade, Skyworks Solutions managed to grow its earnings per share at 3.9% a year. This EPS growth is slower than the share price growth of 8% per year, over the same period. This suggests that market participants hold the company in higher regard, these days. That's not necessarily surprising considering the five-year track record of earnings growth.
The image below shows how EPS has tracked over time (if you click on the image you can see greater detail).
It's probably worth noting that the CEO is paid less than the median at similar sized companies. It's always worth keeping an eye on CEO pay, but a more important question is whether the company will grow earnings throughout the years. Before buying or selling a stock, we always recommend a close examination of historic growth trends, available here..
What About Dividends?
It is important to consider the total shareholder return, as well as the share price return, for any given stock. The TSR is a return calculation that accounts for the value of cash dividends (assuming that any dividend received was reinvested) and the calculated value of any discounted capital raisings and spin-offs. Arguably, the TSR gives a more comprehensive picture of the return generated by a stock. As it happens, Skyworks Solutions' TSR for the last 5 years was 60%, which exceeds the share price return mentioned earlier. This is largely a result of its dividend payments!
A Different Perspective
Skyworks Solutions provided a TSR of 7.2% over the last twelve months. But that was short of the market average. It's probably a good sign that the company has an even better long term track record, having provided shareholders with an annual TSR of 10% over five years. It's quite possible the business continues to execute with prowess, even as the share price gains are slowing. Before spending more time on Skyworks Solutions it might be wise to click here to see if insiders have been buying or selling shares.
If you are like me, then you will not want to miss this free list of growing companies that insiders are buying.
Please note, the market returns quoted in this article reflect the market weighted average returns of stocks that currently trade on American exchanges.
New: Manage All Your Stock Portfolios in One Place
We've created the ultimate portfolio companion for stock investors, and it's free.
• Connect an unlimited number of Portfolios and see your total in one currency
• Be alerted to new Warning Signs or Risks via email or mobile
• Track the Fair Value of your stocks
Have feedback on this article? Concerned about the content? Get in touch with us directly. Alternatively, email editorial-team (at) simplywallst.com.
This article by Simply Wall St is general in nature. We provide commentary based on historical data and analyst forecasts only using an unbiased methodology and our articles are not intended to be financial advice. It does not constitute a recommendation to buy or sell any stock, and does not take account of your objectives, or your financial situation. We aim to bring you long-term focused analysis driven by fundamental data. Note that our analysis may not factor in the latest price-sensitive company announcements or qualitative material. Simply Wall St has no position in any stocks mentioned.
About NasdaqGS:SWKS
Skyworks Solutions
Designs, develops, manufactures, and markets proprietary semiconductor products in the United States, China, South Korea, Taiwan, Europe, the Middle East, Africa, and the rest of Asia-Pacific.
Excellent balance sheet established dividend payer.
Similar Companies
Market Insights

Advertisement
Community Narratives
Groundbreaking therapies that could change the treatment landscape for PTSD, fibromyalgia, MS & Alzheimer’s
Fair Value US$6.20|86.9% undervalued
CM
Community Contributor
DigitalOcean Will Grow 14% by Embracing AI with Paperspace Acquisition
Fair Value US$50.00|40.2% undervalued
NE
Community Contributor
Viant Technology: A Rising AdTech Challenger in the AI-Powered CTV Market
Fair Value US$38.61|62.7% undervalued
BL
Community Contributor
Volvo will Accelerate Forward into Electric and Autonomous Leadership in Five Years
Fair Value SEK 438.80|39.7% undervalued
UN
Community Contributor