
Advertisement
- United States
- /
- Semiconductors
- /
- NasdaqGS:RMBS
Rambus Inc.'s (NASDAQ:RMBS) 26% Dip Still Leaving Some Shareholders Feeling Restless Over Its P/SRatio
Rambus Inc. (NASDAQ:RMBS) shares have had a horrible month, losing 26% after a relatively good period beforehand. Looking at the bigger picture, even after this poor month the stock is up 28% in the last year.
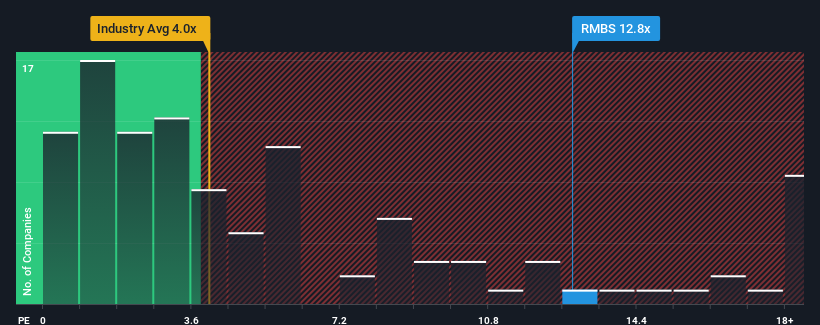
Even after such a large drop in price, Rambus may still be sending strong sell signals at present with a price-to-sales (or "P/S") ratio of 12.8x, when you consider almost half of the companies in the Semiconductor industry in the United States have P/S ratios under 4x and even P/S lower than 1.6x aren't out of the ordinary. Nonetheless, we'd need to dig a little deeper to determine if there is a rational basis for the highly elevated P/S.
View our latest analysis for Rambus
How Has Rambus Performed Recently?
Recent times haven't been great for Rambus as its revenue has been rising slower than most other companies. One possibility is that the P/S ratio is high because investors think this lacklustre revenue performance will improve markedly. You'd really hope so, otherwise you're paying a pretty hefty price for no particular reason.
If you'd like to see what analysts are forecasting going forward, you should check out our free report on Rambus.Is There Enough Revenue Growth Forecasted For Rambus?
There's an inherent assumption that a company should far outperform the industry for P/S ratios like Rambus' to be considered reasonable.
Retrospectively, the last year delivered virtually the same number to the company's top line as the year before. However, a few strong years before that means that it was still able to grow revenue by an impressive 87% in total over the last three years. Accordingly, shareholders will be pleased, but also have some questions to ponder about the last 12 months.
Looking ahead now, revenue is anticipated to climb by 24% per annum during the coming three years according to the eight analysts following the company. That's shaping up to be similar to the 26% per year growth forecast for the broader industry.
With this information, we find it interesting that Rambus is trading at a high P/S compared to the industry. It seems most investors are ignoring the fairly average growth expectations and are willing to pay up for exposure to the stock. Although, additional gains will be difficult to achieve as this level of revenue growth is likely to weigh down the share price eventually.
What Does Rambus' P/S Mean For Investors?
A significant share price dive has done very little to deflate Rambus' very lofty P/S. We'd say the price-to-sales ratio's power isn't primarily as a valuation instrument but rather to gauge current investor sentiment and future expectations.
Analysts are forecasting Rambus' revenues to only grow on par with the rest of the industry, which has lead to the high P/S ratio being unexpected. Right now we are uncomfortable with the relatively high share price as the predicted future revenues aren't likely to support such positive sentiment for long. A positive change is needed in order to justify the current price-to-sales ratio.
Don't forget that there may be other risks. For instance, we've identified 2 warning signs for Rambus (1 is potentially serious) you should be aware of.
It's important to make sure you look for a great company, not just the first idea you come across. So if growing profitability aligns with your idea of a great company, take a peek at this free list of interesting companies with strong recent earnings growth (and a low P/E).
New: AI Stock Screener & Alerts
Our new AI Stock Screener scans the market every day to uncover opportunities.
• Dividend Powerhouses (3%+ Yield)
• Undervalued Small Caps with Insider Buying
• High growth Tech and AI Companies
Or build your own from over 50 metrics.
Have feedback on this article? Concerned about the content? Get in touch with us directly. Alternatively, email editorial-team (at) simplywallst.com.
This article by Simply Wall St is general in nature. We provide commentary based on historical data and analyst forecasts only using an unbiased methodology and our articles are not intended to be financial advice. It does not constitute a recommendation to buy or sell any stock, and does not take account of your objectives, or your financial situation. We aim to bring you long-term focused analysis driven by fundamental data. Note that our analysis may not factor in the latest price-sensitive company announcements or qualitative material. Simply Wall St has no position in any stocks mentioned.
About NasdaqGS:RMBS
Rambus
Manufactures and sells semiconductor products in the United States, South Korea, Singapore, and internationally.
Flawless balance sheet with limited growth.
Similar Companies
Market Insights

Advertisement
Community Narratives
Finding The True Value Of A Logistics Powerhouse
Fair Value US$95.21|8.5% undervalued
NV
Community Contributor
Paradigm Biopharmaceuticals Will Lead Osteoarthritis Treatment with Zilosul's FDA Success
Fair Value AU$5.50|91.9% undervalued
AM
Community Contributor
Barrick Mining (ABX:CA): A Gold Hedge against a U.S. Shutdown
Fair Value CA$60.00|26.5% undervalued
GM
Community Contributor