- United States
- /
- Semiconductors
- /
- NasdaqGS:PI
Assessing Impinj’s Outlook After Strong 33.6% Year-To-Date Rally in 2025

Reviewed by Bailey Pemberton
So, you have got your eye on Impinj stock and are wondering if this is the moment to make your move or to hold back. You are not alone. Impinj has been catching the attention of investors lately, swinging upward by 8.8% in just the past week and logging a solid 33.6% return so far this year. Looking even further back, the story gets more dramatic: a 140.2% gain over three years and a staggering 537.6% over five years. Yet, a glance at the past twelve months reveals a -10.1% drop, a reminder that even fast-growing tech names can face sharp swings as markets digest new information or reassess risks.
Impinj’s recent performance has been shaped in part by renewed interest in technology infrastructure and the expanding demand for connected devices. This is a trend that many see placing Impinj in the sweet spot for long-term growth. Still, the market is constantly recalibrating expectations, which may explain some of the rollercoaster moves we have seen lately.
As for value, things get interesting. According to our six-point valuation framework, Impinj earns a value score of 0 out of 6, meaning it is currently not undervalued by any of the standard checks. But before you jump to conclusions, let us dig into what those valuation approaches actually measure, and, more importantly, explore a smarter way to interpret the numbers before making any big decisions.
Impinj scores just 0/6 on our valuation checks. See what other red flags we found in the full valuation breakdown.
Approach 1: Impinj Discounted Cash Flow (DCF) Analysis
A Discounted Cash Flow (DCF) model estimates a company’s true value by projecting its future cash flows and then discounting those flows back to today’s dollars. For Impinj, this involves taking the company’s current Free Cash Flow of $26.4 million and forecasting where those figures may land over the coming decade.
Analysts expect Impinj’s Free Cash Flow to grow steadily, with projections reaching $37.1 million in 2026, $105.4 million in 2027, and $136.8 million by 2028. Beyond 2028, Simply Wall St extrapolates the pattern with annual estimates building out to $255.5 million by 2035. All values are calculated in US dollars.
Using these figures, the DCF model calculates an estimated intrinsic fair value of $80.15 per share. However, with the current market price sitting 144.7% above this level, the model concludes that Impinj stock is significantly overvalued at this time.
Result: OVERVALUED
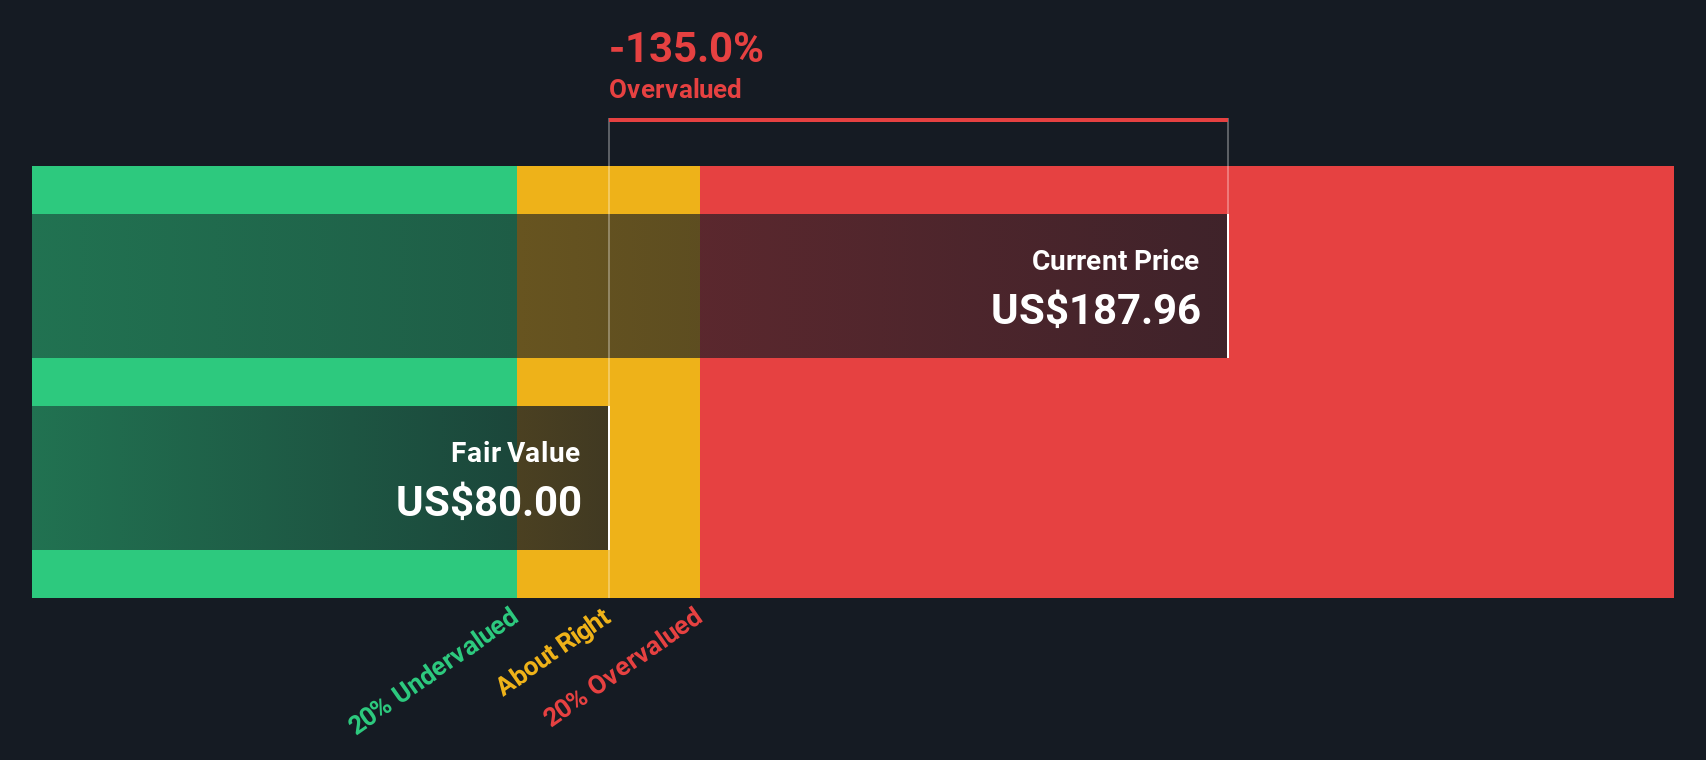
Our Discounted Cash Flow (DCF) analysis suggests Impinj may be overvalued by 144.7%. Find undervalued stocks or create your own screener to find better value opportunities.
Approach 2: Impinj Price vs Sales
For companies like Impinj, the Price-to-Sales (P/S) ratio is often a preferred valuation tool. It is particularly useful for technology firms that are still investing heavily for growth or may not consistently report positive net earnings. The P/S ratio helps investors gauge how much they are paying for each dollar of the company’s revenue, which is important when assessing growth-stage businesses.
It is important to recognize that growth expectations and perceived risk play a significant role in determining what a “normal” or “fair” P/S multiple should be. High-growth companies, or those dominating a niche market, often command higher P/S ratios because investors are willing to pay more for future potential. Conversely, companies facing challenges or operating in riskier environments tend to trade at lower multiples.
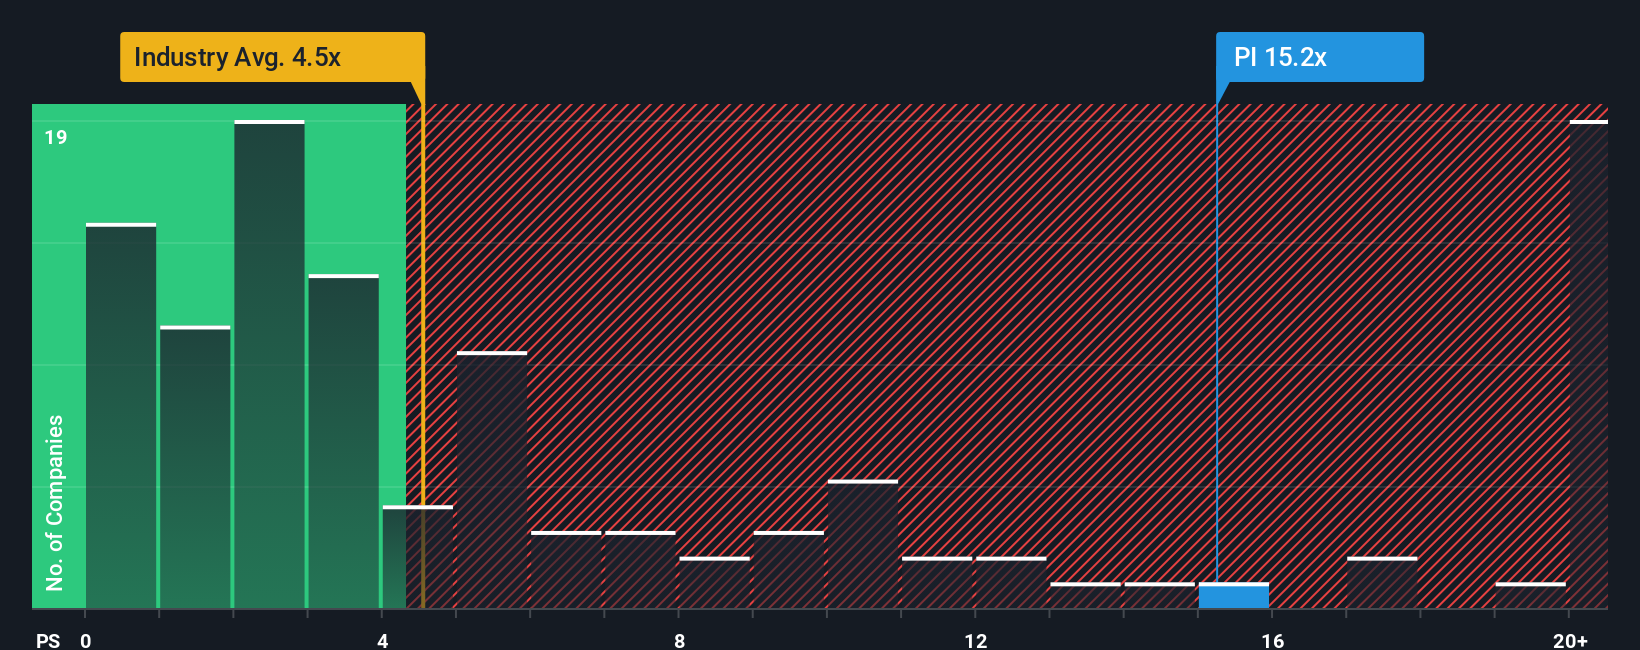
Impinj’s current P/S ratio is 15.90x, well above the semiconductor industry average of 4.90x and the peer average of 6.69x. This might suggest the stock is expensive, but raw comparisons can be misleading. That is where Simply Wall St’s Fair Ratio comes in. At 6.45x for Impinj, it reflects a deeper analysis, factoring in elements like the company’s growth prospects, its specific risks, profit margins, and market capitalization, all within an industry context. This approach provides a more tailored benchmark than industry averages or peer groups alone.
Comparing the Fair Ratio of 6.45x to Impinj’s actual P/S of 15.90x points to a significant premium. Based on this methodology, the stock currently appears overvalued.
Result: OVERVALUED
PS ratios tell one story, but what if the real opportunity lies elsewhere? Discover companies where insiders are betting big on explosive growth.
Upgrade Your Decision Making: Choose your Impinj Narrative
Earlier we mentioned that there is an even better way to understand valuation, so let us introduce you to Narratives. A Narrative is a simple and powerful tool that connects your view (or story) about a company with the actual numbers, such as your assumptions about future sales, earnings, profit margins, and what you believe the stock is truly worth.
Unlike traditional estimates, Narratives let you sketch your perspective on Impinj, linking its unique business trends to your financial forecasts and resulting in a clear fair value. With millions of users already sharing their takes in the Simply Wall St Community, Narratives are accessible and easy to update, especially as new information like earnings and news headlines roll in.
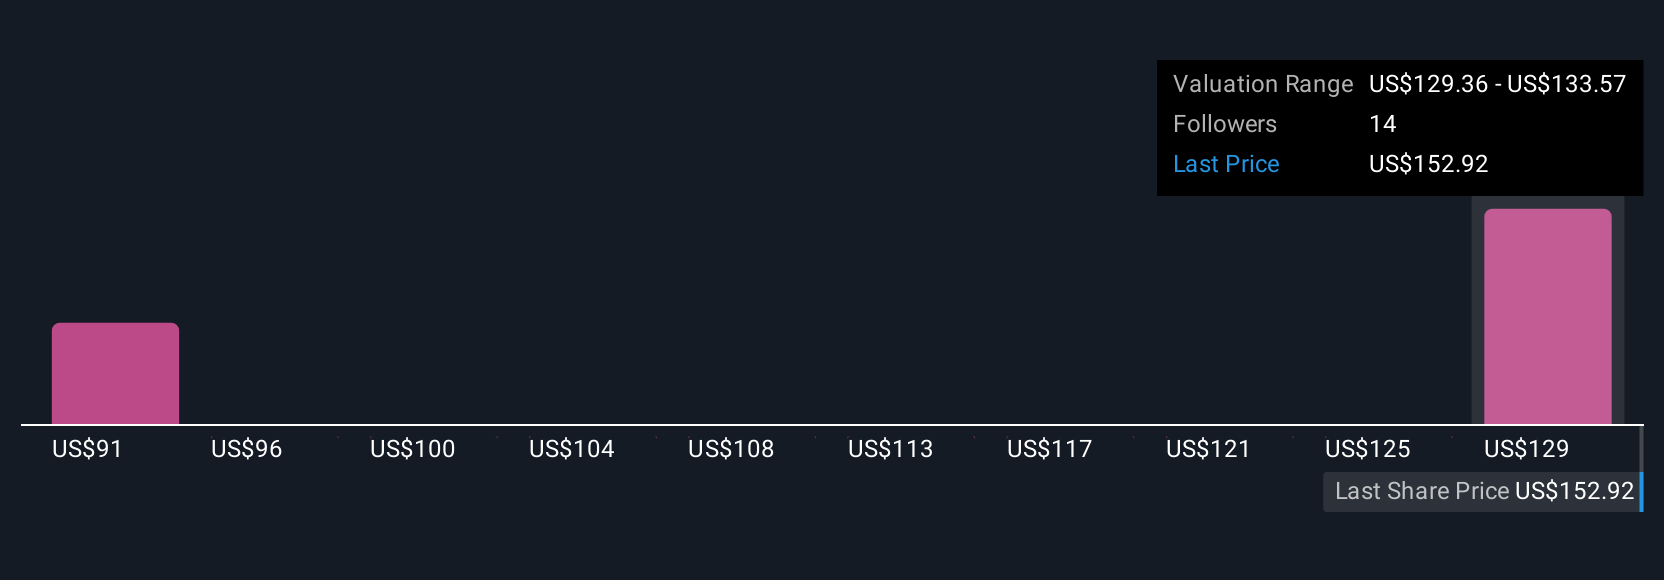
They help you decide when to buy or sell by directly showing how your calculated Fair Value compares to the current market price. For example, some investors view Impinj’s momentum and RFID adoption as grounds for a high fair value, recently estimating $195.00 per share, while others are more cautious, landing nearer $158.00. Both case studies are instantly comparable and dynamic as circumstances change.
Do you think there's more to the story for Impinj? Create your own Narrative to let the Community know!
This article by Simply Wall St is general in nature. We provide commentary based on historical data and analyst forecasts only using an unbiased methodology and our articles are not intended to be financial advice. It does not constitute a recommendation to buy or sell any stock, and does not take account of your objectives, or your financial situation. We aim to bring you long-term focused analysis driven by fundamental data. Note that our analysis may not factor in the latest price-sensitive company announcements or qualitative material. Simply Wall St has no position in any stocks mentioned.
The New Payments ETF Is Live on NASDAQ:
Money is moving to real-time rails, and a newly listed ETF now gives investors direct exposure. Fast settlement. Institutional custody. Simple access.
Explore how this launch could reshape portfolios
Sponsored ContentNew: AI Stock Screener & Alerts
Our new AI Stock Screener scans the market every day to uncover opportunities.
• Dividend Powerhouses (3%+ Yield)
• Undervalued Small Caps with Insider Buying
• High growth Tech and AI Companies
Or build your own from over 50 metrics.
Have feedback on this article? Concerned about the content? Get in touch with us directly. Alternatively, email editorial-team@simplywallst.com
About NasdaqGS:PI
Impinj
Operates a cloud connectivity platform in the Americas, the Asia Pacific, Europe, the Middle East, and Africa.
High growth potential with adequate balance sheet.
Similar Companies
Market Insights

Weekly Picks

THE KINGDOM OF BROWN GOODS: WHY MGPI IS BEING CRUSHED BY INVENTORY & PRIMED FOR RESURRECTION


Why Vertical Aerospace (NYSE: EVTL) is Worth Possibly Over 13x its Current Price


The Quiet Giant That Became AI’s Power Grid
Recently Updated Narratives


A tech powerhouse quietly powering the world’s AI infrastructure.


Keppel DC REIT (SGX: AJBU) is a resilient gem in the data center space.
Why Vertical Aerospace (NYSE: EVTL) is Worth Possibly Over 13x its Current Price
Popular Narratives

MicroVision will explode future revenue by 380.37% with a vision towards success


Crazy Undervalued 42 Baggers Silver Play (Active & Running Mine)


