Advertisement
- United States
- /
- Semiconductors
- /
- NasdaqGS:OLED
Is Universal Display Stock Pricing In 29% Drop Despite Recent OLED Market Buzz?

Simply Wall St
Reviewed by Bailey Pemberton
If you are eyeing Universal Display and wondering whether now is the right time to buy, hold, or rethink your position, you are not alone. The stock has been on quite the journey lately, moving up 1.5% over the past week, and nudging just 1.0% higher in the last month. Still, the picture gets more complicated as you zoom out. Over the past year, shares are down almost 29.1%, partly retracing the impressive 55.6% gain from three years ago. The five-year return stands at -23.4%. For many investors, these numbers can signal seasonality, shifts in growth outlooks, or even changing risk perceptions in the display technology industry.
There have been some noteworthy shifts in the broader markets, particularly in tech stocks, that have played a role in Universal Display’s recent share price movements. Industry optimism about OLED technology partnerships and its expanding role in consumer electronics has sparked occasional bursts of buying, even as the long-term trajectory has felt bumpy. At Friday’s close of $146.87 per share, investors are right to wonder whether the market is just warming up or if sentiment is still too chilly.
To answer that properly, we need to dig deeper into valuation. Universal Display notched a score of 3 out of 6 on our valuation checklist, indicating it is undervalued on half of the key metrics. Up next, I will walk you through the most useful ways to value the company and suggest a smarter valuation approach you might not be using yet.
Why Universal Display is lagging behind its peers
Approach 1: Universal Display Discounted Cash Flow (DCF) Analysis
The Discounted Cash Flow (DCF) model estimates a company's intrinsic value by projecting its future cash flows and discounting them back to today’s dollars. This approach aims to determine what the business is really worth, based on its ability to generate cash in the future.
For Universal Display, the latest reported Free Cash Flow stands at $119.2 million. Analysts provide direct forecasts for up to five years, but after that, future cash flows are extrapolated using growth estimates. That means, looking ahead to 2026, the projected Free Cash Flow is $222 million. By 2035, ten years out, models suggest Free Cash Flow could reach about $391.6 million. However, numbers beyond 2026 are best viewed as educated projections rather than precise predictions.
Summing these projected cash flows and discounting them appropriately, the DCF model calculates a fair value for Universal Display stock at $85.40 per share. With the current share price at $146.87, this implies Universal Display is trading at a roughly 72% premium to its intrinsic value. In simple terms, the stock looks significantly overvalued based on future cash flow estimates.
Result: OVERVALUED
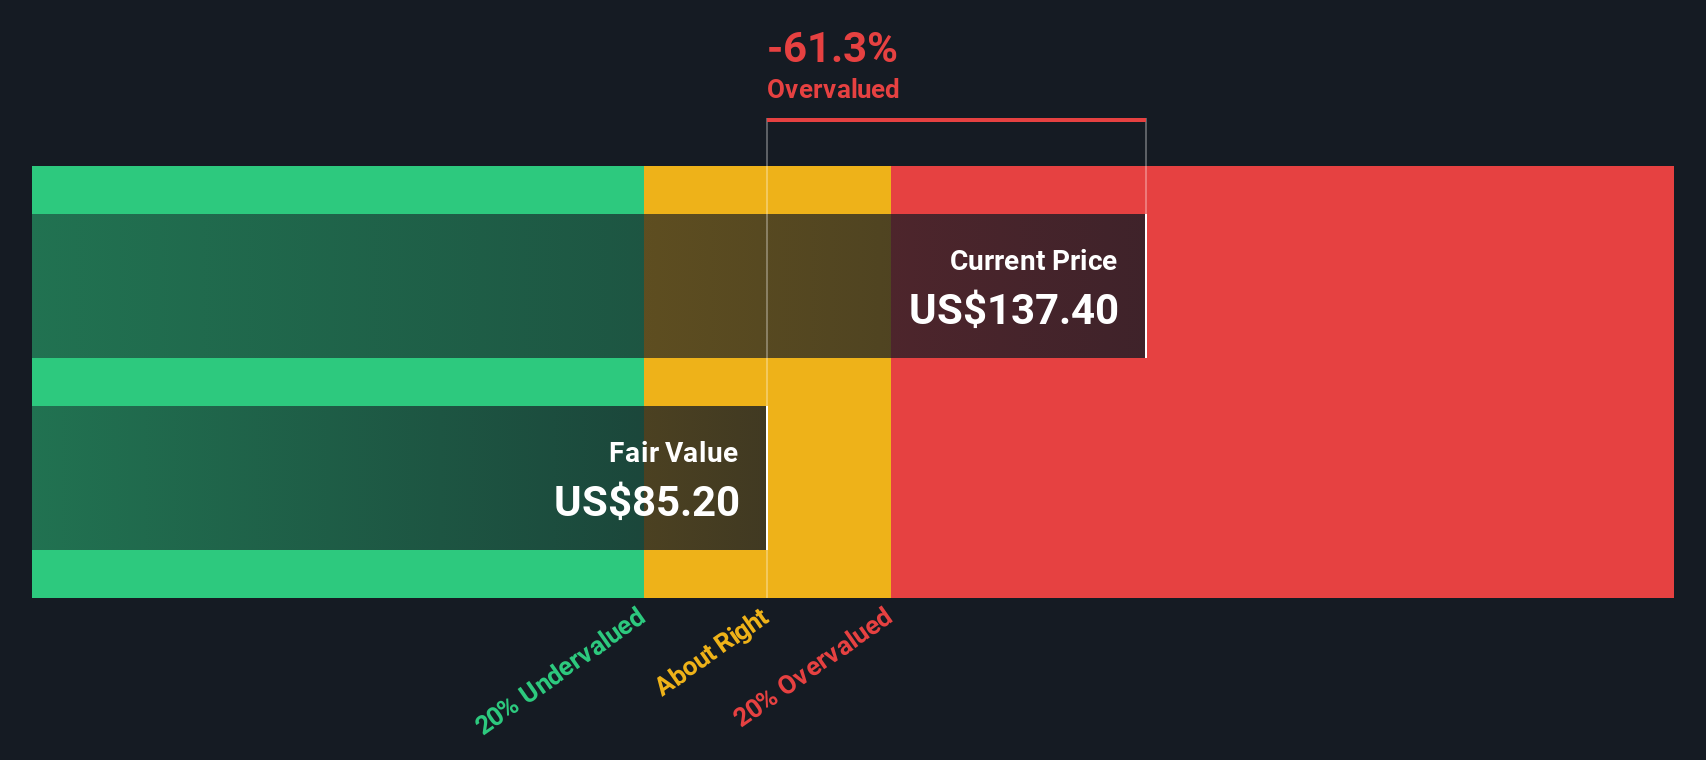
Our Discounted Cash Flow (DCF) analysis suggests Universal Display may be overvalued by 72.0%. Find undervalued stocks or create your own screener to find better value opportunities.
Approach 2: Universal Display Price vs Earnings
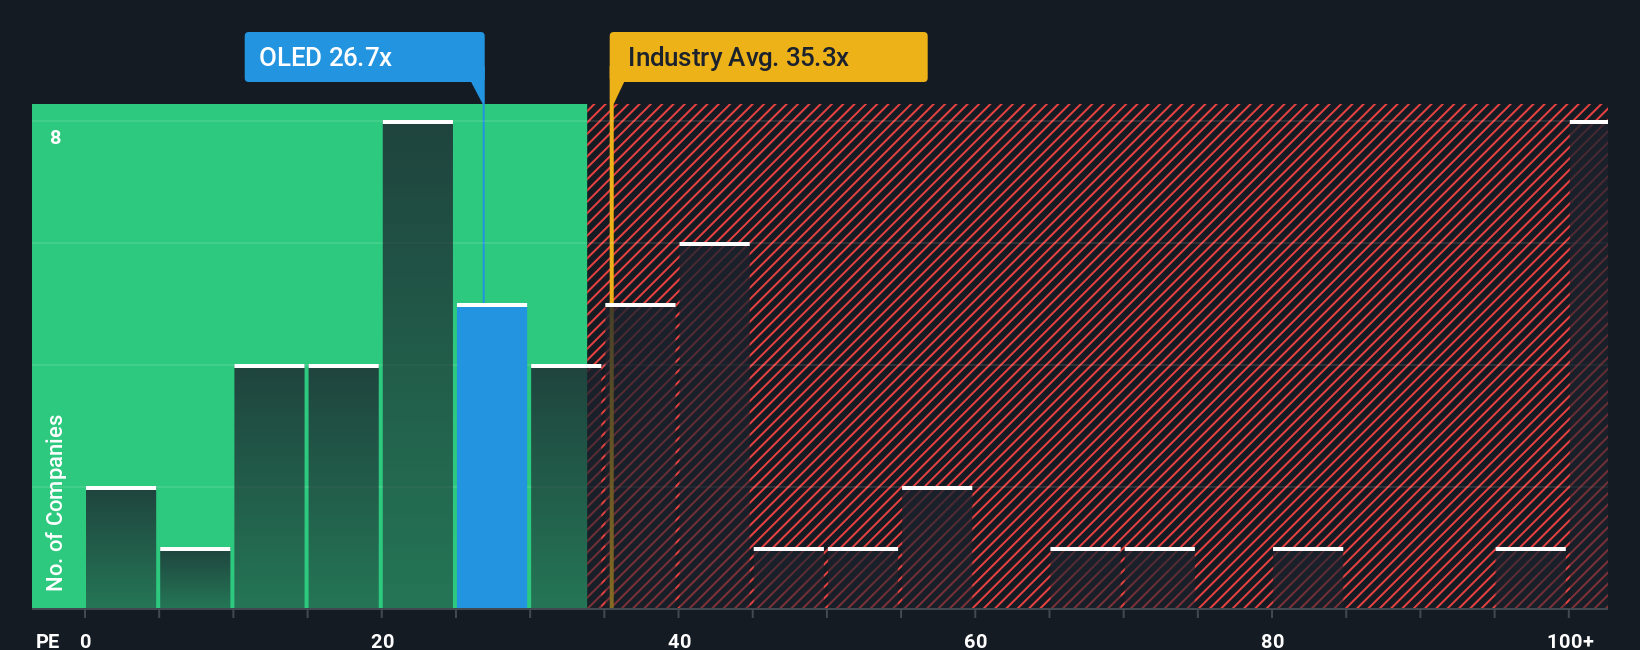
The Price-to-Earnings (PE) ratio is a widely used valuation measure for profitable companies because it shows how much investors are willing to pay for each dollar of earnings. A company’s PE ratio often reflects not just its recent profitability, but also expectations for future growth and the risks investors see on the horizon. Put simply, higher growth prospects or lower perceived risk often justify a higher PE. Conversely, slower growth or higher risk typically lead to a lower PE being considered “fair.”
Universal Display is currently trading at a PE ratio of 28.6x. For context, the average PE across the broader semiconductor industry is higher at 37.8x, while its peer group averages an even loftier 53.5x. At first glance, this makes Universal Display look attractively priced compared to these benchmarks.
However, a more customized approach uses the Fair Ratio, a proprietary Simply Wall St metric that factors in not just industry averages, but the company’s growth outlook, profit margins, size, and risk profile. In Universal Display’s case, the Fair Ratio is 23.6x. This offers a more nuanced yardstick than broad industry or peer averages, helping investors avoid misleading comparisons and focus on what this stock truly deserves based on its unique traits.
Comparing Universal Display’s current PE of 28.6x with its Fair Ratio of 23.6x, the stock appears somewhat expensive by this measure.
Result: OVERVALUED
PE ratios tell one story, but what if the real opportunity lies elsewhere? Discover companies where insiders are betting big on explosive growth.
Upgrade Your Decision Making: Choose your Universal Display Narrative
Earlier we mentioned there is an even better way to understand valuation, so let’s introduce you to Narratives. A Narrative is a simple, powerful tool that allows you to connect your story and perspective on a company to the numbers that drive its fair value. This links your assumptions about Universal Display’s future revenue, earnings, and margins directly to a financial forecast and target price.
On Simply Wall St’s Community page, Narratives make it easy and accessible for anyone to articulate their view, back it up with their own assumptions, and see how it compares to both the latest fair value and the current share price. This means you can decide whether to buy or sell based on your unique forecast rather than just generic industry averages or historical ratios.
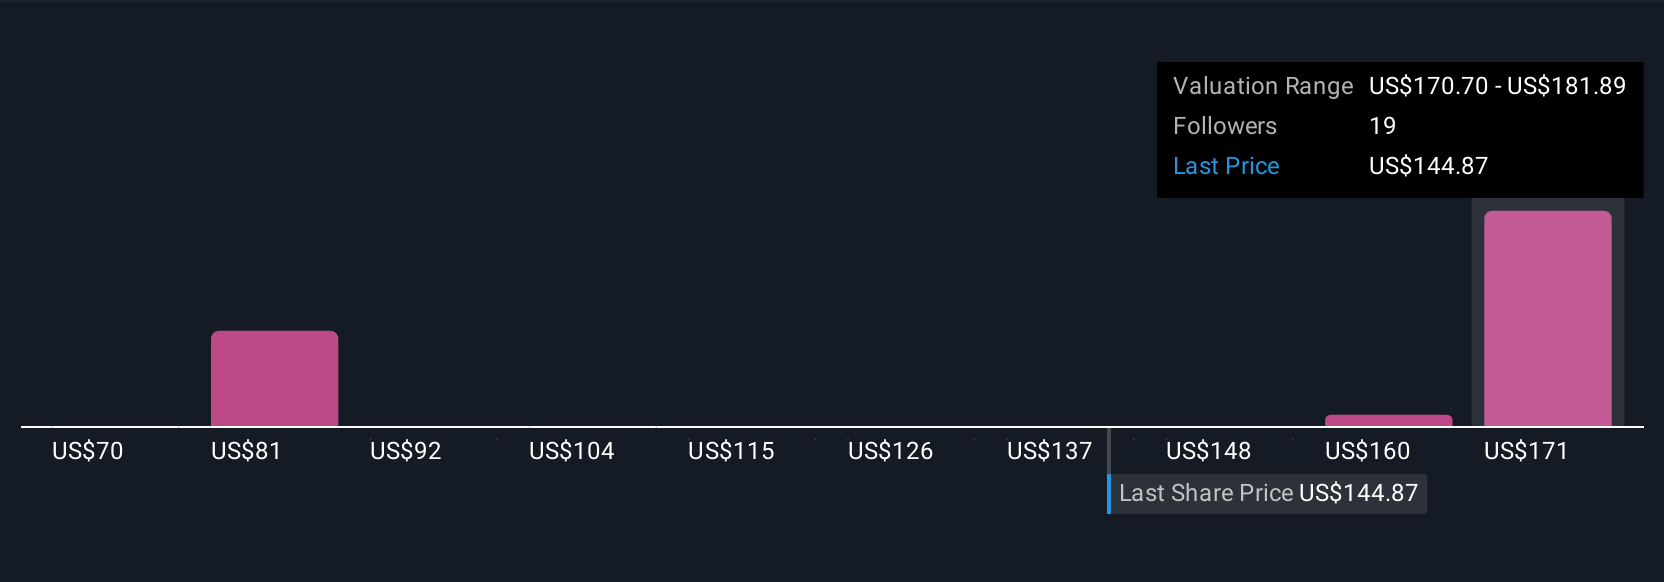
What's even more powerful is that Narratives update dynamically as news breaks or new earnings come in, so your scenario and fair value can stay current with the latest information. For example, some investors are optimistic that Universal Display will outperform thanks to rapid OLED adoption, setting a fair value above $220, while others are cautious about industry headwinds and estimate just $160. This shows how different stories lead to different investment decisions.
Do you think there's more to the story for Universal Display? Create your own Narrative to let the Community know!
This article by Simply Wall St is general in nature. We provide commentary based on historical data and analyst forecasts only using an unbiased methodology and our articles are not intended to be financial advice. It does not constitute a recommendation to buy or sell any stock, and does not take account of your objectives, or your financial situation. We aim to bring you long-term focused analysis driven by fundamental data. Note that our analysis may not factor in the latest price-sensitive company announcements or qualitative material. Simply Wall St has no position in any stocks mentioned.
New: AI Stock Screener & Alerts
Our new AI Stock Screener scans the market every day to uncover opportunities.
• Dividend Powerhouses (3%+ Yield)
• Undervalued Small Caps with Insider Buying
• High growth Tech and AI Companies
Or build your own from over 50 metrics.
Have feedback on this article? Concerned about the content? Get in touch with us directly. Alternatively, email editorial-team@simplywallst.com
About NasdaqGS:OLED
Universal Display
Engages in the research, development, and commercialization of organic light emitting diode (OLED) technologies and materials for use in display and solid-state lighting applications.
Flawless balance sheet with proven track record.
Similar Companies
Market Insights

Advertisement
Community Narratives
The Next Phase of Energy Storage: How NeoVolta Is Tackling America’s Power Crunch
Fair Value US$7.50|30.4% undervalued
MA
Community Contributor
A formidable player in AI and enterprise computing.
Fair Value US$210.00|3.0% undervalued
CO
Community Contributor
IREN's Bold Moves in Sustainable Bitcoin Mining & AI Data Centers
Fair Value US$72.52|20.4% undervalued
BL
Community Contributor
Cooling the Champions: The Aussie Tech Behind F1's Victories
Fair Value AU$12.40|38.1% undervalued
TR
Community Contributor