- United States
- /
- Semiconductors
- /
- NasdaqGS:NVMI
Here's What To Make Of Nova's (NASDAQ:NVMI) Decelerating Rates Of Return


Did you know there are some financial metrics that can provide clues of a potential multi-bagger? Typically, we'll want to notice a trend of growing return on capital employed (ROCE) and alongside that, an expanding base of capital employed. If you see this, it typically means it's a company with a great business model and plenty of profitable reinvestment opportunities. With that in mind, the ROCE of Nova (NASDAQ:NVMI) looks decent, right now, so lets see what the trend of returns can tell us.
Understanding Return On Capital Employed (ROCE)
Just to clarify if you're unsure, ROCE is a metric for evaluating how much pre-tax income (in percentage terms) a company earns on the capital invested in its business. Analysts use this formula to calculate it for Nova:
Return on Capital Employed = Earnings Before Interest and Tax (EBIT) ÷ (Total Assets - Current Liabilities)
0.16 = US$134m ÷ (US$1.2b - US$338m) (Based on the trailing twelve months to March 2024).
Therefore, Nova has an ROCE of 16%. In absolute terms, that's a satisfactory return, but compared to the Semiconductor industry average of 9.7% it's much better.
Check out our latest analysis for Nova
In the above chart we have measured Nova's prior ROCE against its prior performance, but the future is arguably more important. If you're interested, you can view the analysts predictions in our free analyst report for Nova .
What Can We Tell From Nova's ROCE Trend?
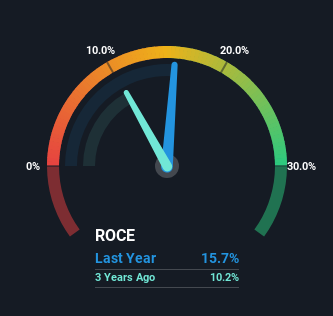
The trend of ROCE doesn't stand out much, but returns on a whole are decent. Over the past five years, ROCE has remained relatively flat at around 16% and the business has deployed 166% more capital into its operations. 16% is a pretty standard return, and it provides some comfort knowing that Nova has consistently earned this amount. Over long periods of time, returns like these might not be too exciting, but with consistency they can pay off in terms of share price returns.
On another note, while the change in ROCE trend might not scream for attention, it's interesting that the current liabilities have actually gone up over the last five years. This is intriguing because if current liabilities hadn't increased to 28% of total assets, this reported ROCE would probably be less than16% because total capital employed would be higher.The 16% ROCE could be even lower if current liabilities weren't 28% of total assets, because the the formula would show a larger base of total capital employed. So while current liabilities isn't high right now, keep an eye out in case it increases further, because this can introduce some elements of risk.
The Bottom Line
To sum it up, Nova has simply been reinvesting capital steadily, at those decent rates of return. And long term investors would be thrilled with the 743% return they've received over the last five years. So even though the stock might be more "expensive" than it was before, we think the strong fundamentals warrant this stock for further research.
If you're still interested in Nova it's worth checking out our FREE intrinsic value approximation for NVMI to see if it's trading at an attractive price in other respects.
If you want to search for solid companies with great earnings, check out this free list of companies with good balance sheets and impressive returns on equity.
Valuation is complex, but we're here to simplify it.
Discover if Nova might be undervalued or overvalued with our detailed analysis, featuring fair value estimates, potential risks, dividends, insider trades, and its financial condition.
Access Free AnalysisHave feedback on this article? Concerned about the content? Get in touch with us directly. Alternatively, email editorial-team (at) simplywallst.com.
This article by Simply Wall St is general in nature. We provide commentary based on historical data and analyst forecasts only using an unbiased methodology and our articles are not intended to be financial advice. It does not constitute a recommendation to buy or sell any stock, and does not take account of your objectives, or your financial situation. We aim to bring you long-term focused analysis driven by fundamental data. Note that our analysis may not factor in the latest price-sensitive company announcements or qualitative material. Simply Wall St has no position in any stocks mentioned.
About NasdaqGS:NVMI
Nova
Designs, develops, produces, and sells process control systems used in the manufacture of semiconductors in Israel, Taiwan, the United States, China, Korea, and internationally.
Solid track record with excellent balance sheet.
Similar Companies
Market Insights

Community Narratives

