Advertisement
- United States
- /
- Semiconductors
- /
- NasdaqGS:NVMI
Are Nova Shares Running Ahead After 58.5% Jump in 2025?

Simply Wall St
Reviewed by Bailey Pemberton
If you are eyeing Nova stock right now, you are definitely not alone. After an impressive multi-year climb, with gains of 450.8% in the past five years and 345.1% in three, the company is generating serious buzz among investors wondering if there is more runway for growth. Even in the past year, Nova tacked on 52.6% to its share price, with 58.5% gained since the start of this year alone. That’s not to say it has been a smooth ride. Over the last month, Nova rallied a remarkable 17.5%, though the most recent week saw a slight 3.0% dip. This is a reminder that sentiment and risk perception can change fast. These swings have kept market watchers glued to news about Nova and the broader sector, searching for signals to inform their next move.
With such dramatic price movement, the real question becomes whether Nova’s current share price makes sense, or if momentum is getting ahead of reality. To get a handle on that, we turn to a range of standard valuation checks. Nova’s valuation score sits at 0, indicating it does not come up undervalued in any of the six common checks analysts typically use. But as you will see, sometimes the headline numbers only tell part of the story, and the most revealing insights come from digging a little deeper. Next, let’s break down exactly how these valuation methods stack up, before exploring an even more insightful way to think about what Nova is really worth.
Nova scores just 0/6 on our valuation checks. See what other red flags we found in the full valuation breakdown.
Approach 1: Nova Discounted Cash Flow (DCF) Analysis
The Discounted Cash Flow (DCF) model estimates what a business is worth today based on projections of how much cash it will generate in the future. Essentially, it adds up all expected future cash flows and then discounts them back to the present, reflecting what that future money is worth right now. This model is especially useful for companies like Nova, where cash generation is steady and somewhat predictable.
For Nova, the latest reported Free Cash Flow (FCF) stands at $204.7 million. Analysts project this figure will rise to $240.7 million by 2026, with longer-term forecasts suggesting FCF could grow to roughly $370.4 million by 2035. Estimates out to 2030 and beyond rely on extending existing analyst projections, so there is more uncertainty in the later years. All cash flow values here are in $USD, as per the company’s financial reporting.
Using these cash flow expectations, the DCF model calculates Nova's intrinsic value per share as $91.08. When compared to the current share price, this implies Nova is trading 253.0% above what the model says it is worth. This suggests the stock looks significantly overvalued by this measure.
Result: OVERVALUED
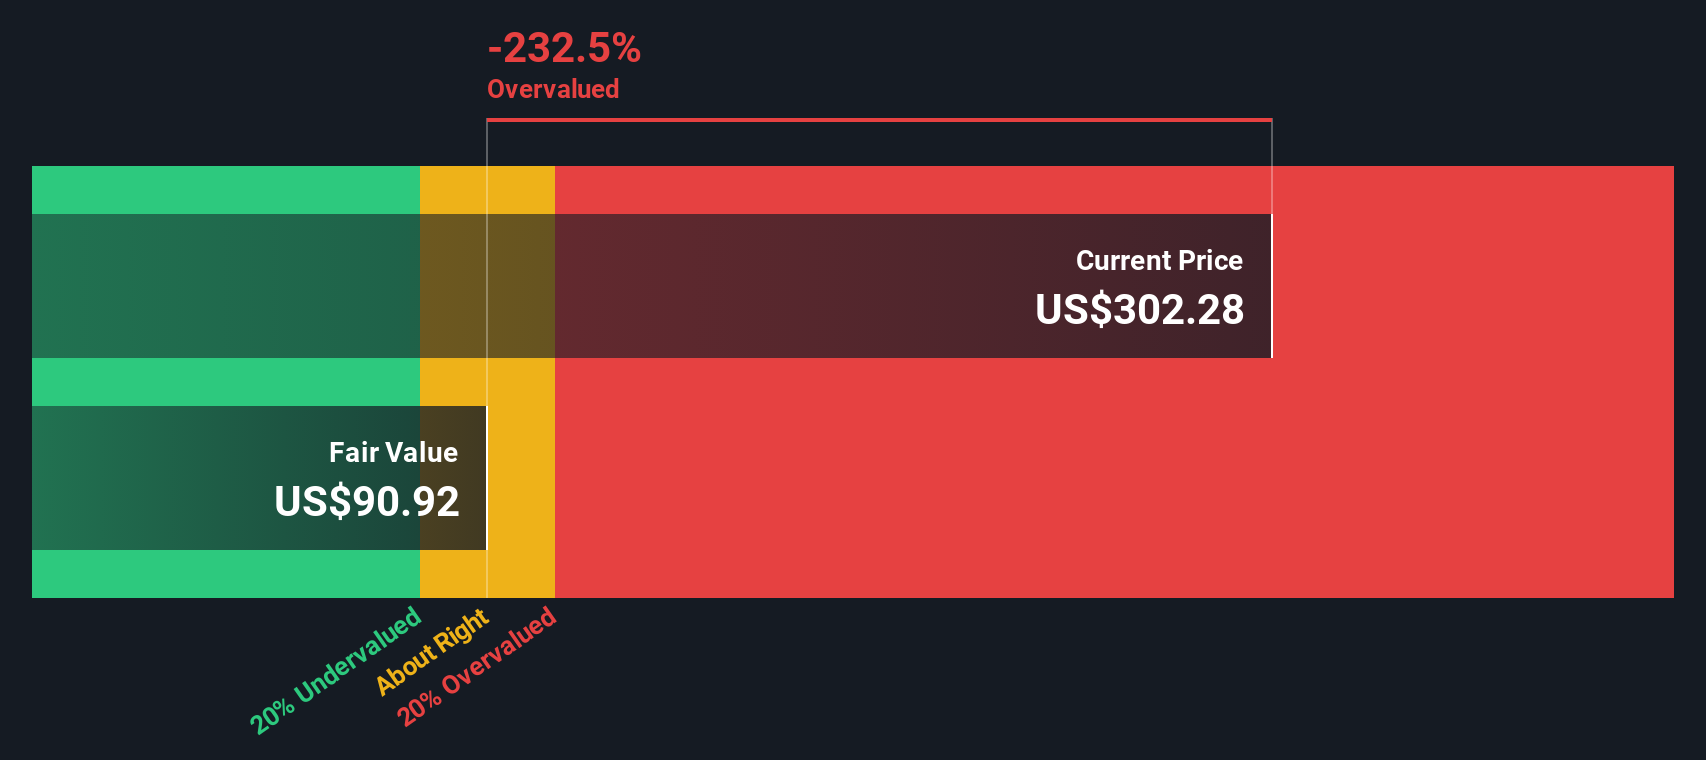
Our Discounted Cash Flow (DCF) analysis suggests Nova may be overvalued by 253.0%. Find undervalued stocks or create your own screener to find better value opportunities.
Approach 2: Nova Price vs Earnings (PE Ratio)
For profitable companies like Nova, the price-to-earnings (PE) ratio is a popular metric because it directly links a company’s market value to its actual earnings. This makes it a simple, intuitive way for investors to gauge whether they are paying a reasonable price for each dollar of profit. Higher-growth companies typically trade at higher PE ratios, but that premium only makes sense if those growth expectations are realistic and the risks are manageable.
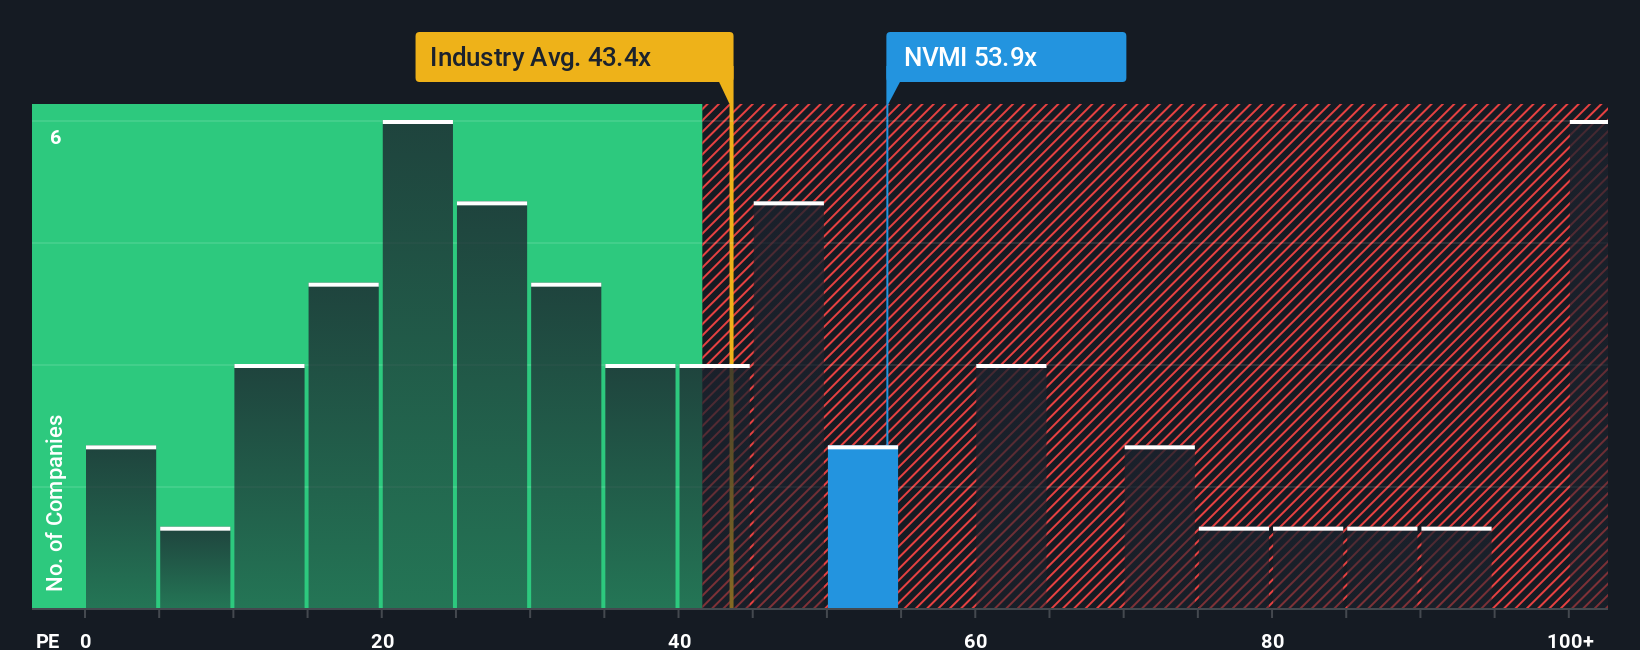
Nova’s current PE ratio sits at 40.6x, which is noticeably above both the semiconductor industry average of 36.2x and the peer average of 33.1x. However, not all companies are created equal. A higher or lower PE ratio should take into account more than just basic comparisons. For this reason, Simply Wall St’s proprietary “Fair Ratio” examines additional company-specific factors such as earnings growth forecasts, profit margins, industry dynamics, market cap, and risk levels, resulting in a more tailored benchmark. Currently, Nova’s Fair Ratio is assessed at 24.2x.
Comparing Nova’s actual PE ratio (40.6x) to its Fair Ratio (24.2x) shows the stock is trading significantly above the value you’d expect given its fundamentals and growth outlook. This points to a market valuation that may be pricing in quite a bit of optimism.
Result: OVERVALUED
PE ratios tell one story, but what if the real opportunity lies elsewhere? Discover companies where insiders are betting big on explosive growth.
Upgrade Your Decision Making: Choose your Nova Narrative
Earlier we mentioned that there is an even better way to understand valuation, so let's introduce you to Narratives. A Narrative is a simple story you create or select that explains your view on Nova’s future by combining your own assumptions about the company’s revenue, earnings, margins, and industry outlook into one clear financial picture.
Narratives connect what you believe about Nova’s business, such as growth drivers, competitive advantages, or potential risks, to actual forecast numbers and an estimate of fair value. With Narratives on Simply Wall St’s Community page, millions of investors can easily build, view, and debate research-backed stories that update automatically with every new earnings release or news event.
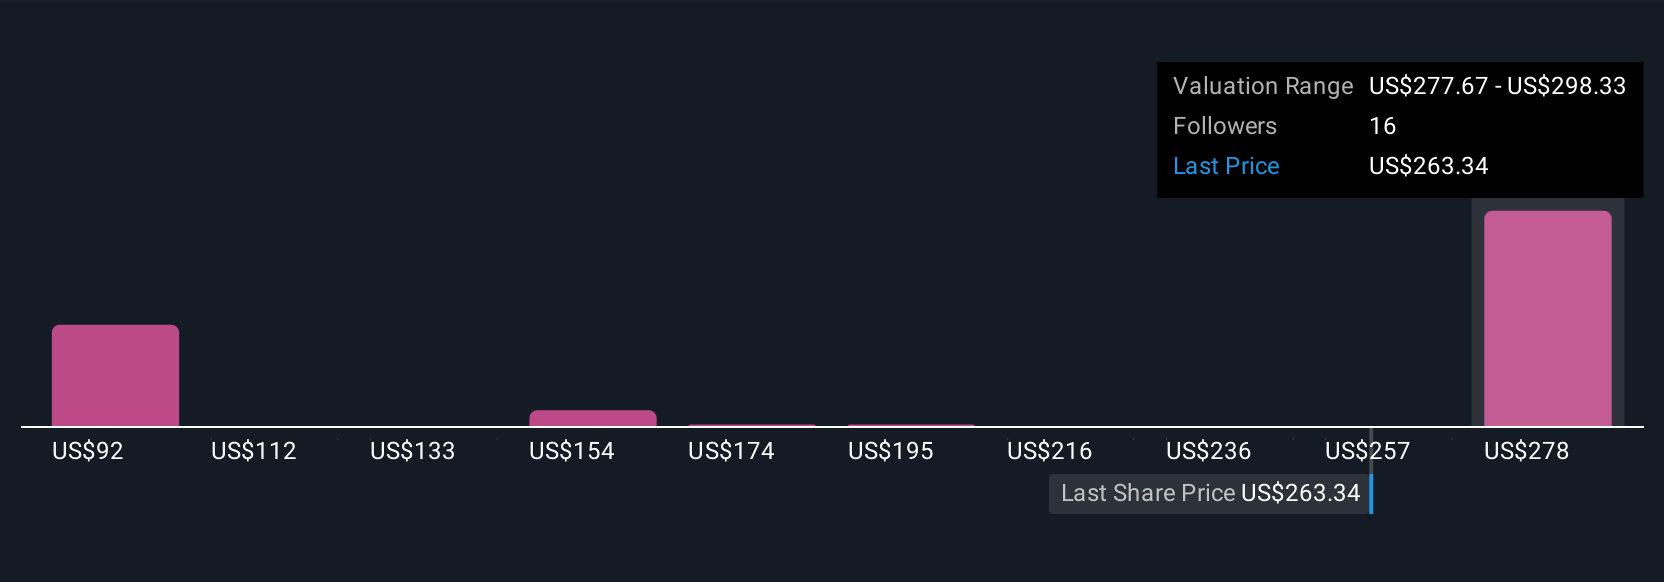
This empowers you to compare Nova’s fair value, based on your Narrative, directly to its current market price, helping you decide if now is the right time to buy, hold, or sell. For example, some investors choose a Narrative that expects global digitization trends and product innovation will push Nova’s fair value as high as $306.67, while others focus on risks like customer concentration and competitive pressure, ending up with a much lower price target.
Do you think there's more to the story for Nova? Create your own Narrative to let the Community know!
This article by Simply Wall St is general in nature. We provide commentary based on historical data and analyst forecasts only using an unbiased methodology and our articles are not intended to be financial advice. It does not constitute a recommendation to buy or sell any stock, and does not take account of your objectives, or your financial situation. We aim to bring you long-term focused analysis driven by fundamental data. Note that our analysis may not factor in the latest price-sensitive company announcements or qualitative material. Simply Wall St has no position in any stocks mentioned.
Valuation is complex, but we're here to simplify it.
Discover if Nova might be undervalued or overvalued with our detailed analysis, featuring fair value estimates, potential risks, dividends, insider trades, and its financial condition.
Access Free AnalysisHave feedback on this article? Concerned about the content? Get in touch with us directly. Alternatively, email editorial-team@simplywallst.com
About NasdaqGS:NVMI
Nova
Engages in the design, development, production, and sells of process control systems used in the manufacture of semiconductors in Taiwan, the United States, China, Korea, and internationally.
Outstanding track record with excellent balance sheet.
Similar Companies
Market Insights

Advertisement
Community Narratives
A formidable player in AI and enterprise computing.
Fair Value US$210.00|12.2% overvalued
CO
Community Contributor
IREN's Bold Moves in Sustainable Bitcoin Mining & AI Data Centers
Fair Value US$72.52|17.1% undervalued
BL
Community Contributor
Cooling the Champions: The Aussie Tech Behind F1's Victories
Fair Value AU$12.40|38.1% undervalued
TR
Community Contributor