Advertisement
- United States
- /
- Specialty Stores
- /
- NYSE:TJX
Does the Recent TJX Dividend Hike Justify Its Current Share Price in 2025?

Simply Wall St
Reviewed by Bailey Pemberton
If you’ve been watching TJX Companies and wondering if now is your moment to buy, hold, or cash in, you are far from alone. Investors appreciate a retail success story, and with TJX’s strong showing over the past few years, the stock has received plenty of attention. After all, long-term holders have seen their shares rise by more than 170% over the last five years. That said, the stock has been relatively flat over the past month, with a slight 0.6% uptick, and actually slipped by 1.9% last week. For those monitoring volatility, this can be a sign that expectations are settling in, possibly in anticipation of broader market shifts or changing consumer habits. Both of these factors have created ripples in retail stocks more generally.
But the heart of the matter with any stock, especially one as prominent as TJX, comes down to value. Is the stock priced fairly, or is there a disconnect between enthusiasm and fundamentals? According to commonly used valuation checks, TJX currently scores a 0 out of 6. By these measures, it does not appear undervalued. That is a number worth paying attention to. In the following sections, we will break down how that score is calculated by looking at standard valuation approaches. We will also discuss a smarter, more nuanced way to think about valuation before we wrap up.
TJX Companies scores just 0/6 on our valuation checks. See what other red flags we found in the full valuation breakdown.
Approach 1: TJX Companies Discounted Cash Flow (DCF) Analysis
The Discounted Cash Flow (DCF) model estimates a company's intrinsic value by projecting its future cash flows and then discounting those amounts back to today's dollars. This approach provides a theoretical value for the entire company based on the cash it is expected to generate over time.
For TJX Companies, the DCF model begins with last year's Free Cash Flow (FCF) of $4.05 Billion. Analyst forecasts provide detailed estimates for the next five years, with FCF projected to reach $5.22 Billion by the fiscal year ending January 2029. Beyond that, Simply Wall St extrapolates additional cash flow growth based on recent trends, ultimately modeling out ten years of FCF estimates.
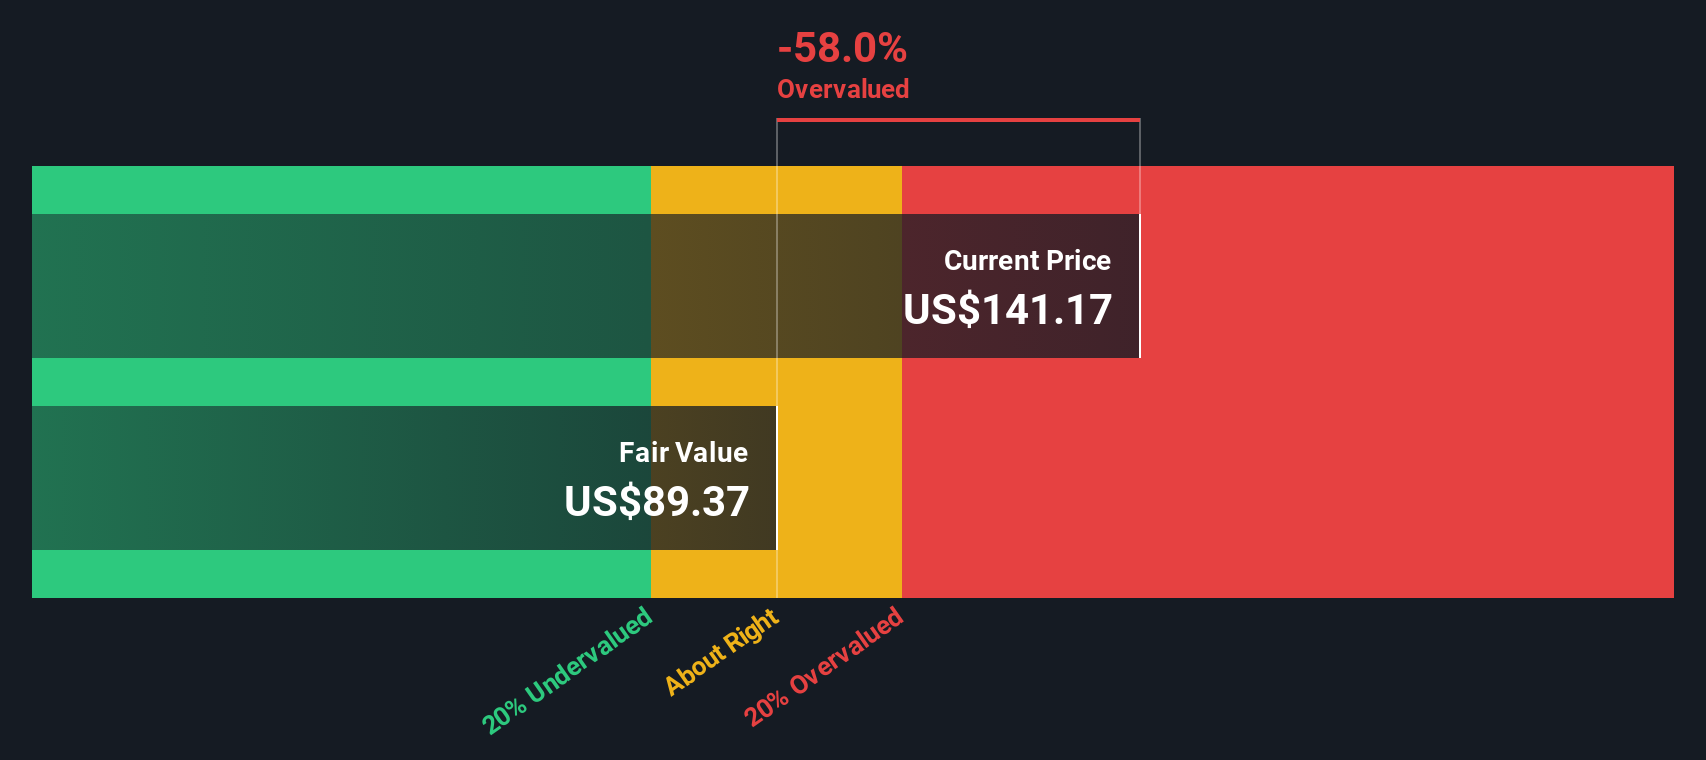
Based on these assumptions and projections, the DCF model calculates an intrinsic value of $81.92 per share for TJX Companies. With the stock currently trading at a price implying a 71.4% premium to this estimated value, the DCF suggests that TJX is significantly overvalued relative to its projected cash flows.
Result: OVERVALUED
Our Discounted Cash Flow (DCF) analysis suggests TJX Companies may be overvalued by 71.4%. Find undervalued stocks or create your own screener to find better value opportunities.
Approach 2: TJX Companies Price vs Earnings
For a consistently profitable company like TJX Companies, the Price-to-Earnings (PE) ratio is a widely used and useful metric to assess valuation. It measures how much investors are currently willing to pay for one dollar of TJX's earnings, which is especially relevant for mature businesses with steady profit growth. The "right" PE ratio for a stock is not universal. It reflects how investors weigh the company's growth expectations and potential risks in the context of the broader market and industry.
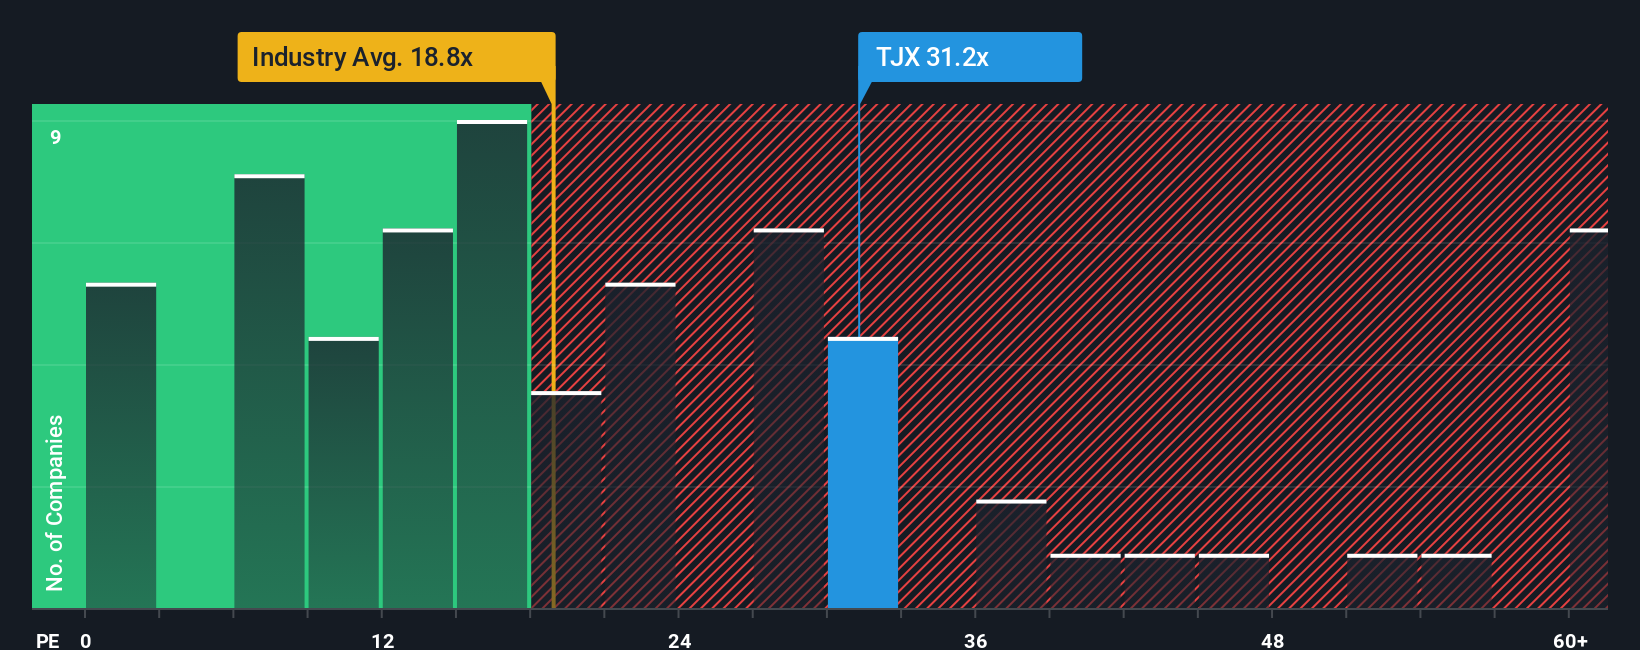
Currently, TJX Companies is trading at a PE ratio of 31.4x. For comparison, the average PE ratio among its peer group stands at 18.4x, and the broader Specialty Retail industry average is only 15.8x. This indicates that TJX is priced at a significant premium relative to both its direct competitors and the industry as a whole.
To provide additional nuance, Simply Wall St calculates a proprietary metric called the “Fair Ratio.” This takes into account multiple company-specific factors, including earnings growth rates, profit margins, risk profile, industry classification, and market capitalization, to determine what would be a fair and balanced PE for TJX specifically. Unlike a simple peer or industry comparison, the Fair Ratio is designed to reflect the company’s unique context and prospects. For TJX Companies, the Fair Ratio stands at 20.9x.
With TJX’s current PE ratio at 31.4x, which is substantially higher than its Fair Ratio of 20.9x, this alternative valuation approach also points to shares being overvalued by historical and company-adjusted benchmarks.
Result: OVERVALUED
PE ratios tell one story, but what if the real opportunity lies elsewhere? Discover companies where insiders are betting big on explosive growth.
Upgrade Your Decision Making: Choose your TJX Companies Narrative
Earlier we mentioned that there's an even better way to understand valuation, so let's introduce you to Narratives. A Narrative is a way to connect your personal perspective on a company, such as your expectations for TJX Companies’ future revenues, earnings, or profit margins, with a financial forecast and ultimately a fair value estimate.
Instead of relying on generic metrics, Narratives allow you to tell the story behind the numbers, linking real-world developments and your investment thesis to what you believe the company is actually worth. Within Simply Wall St’s Community page, creating or exploring Narratives is easy, making them an accessible tool for investors at any level, and they are utilized by millions of users worldwide.
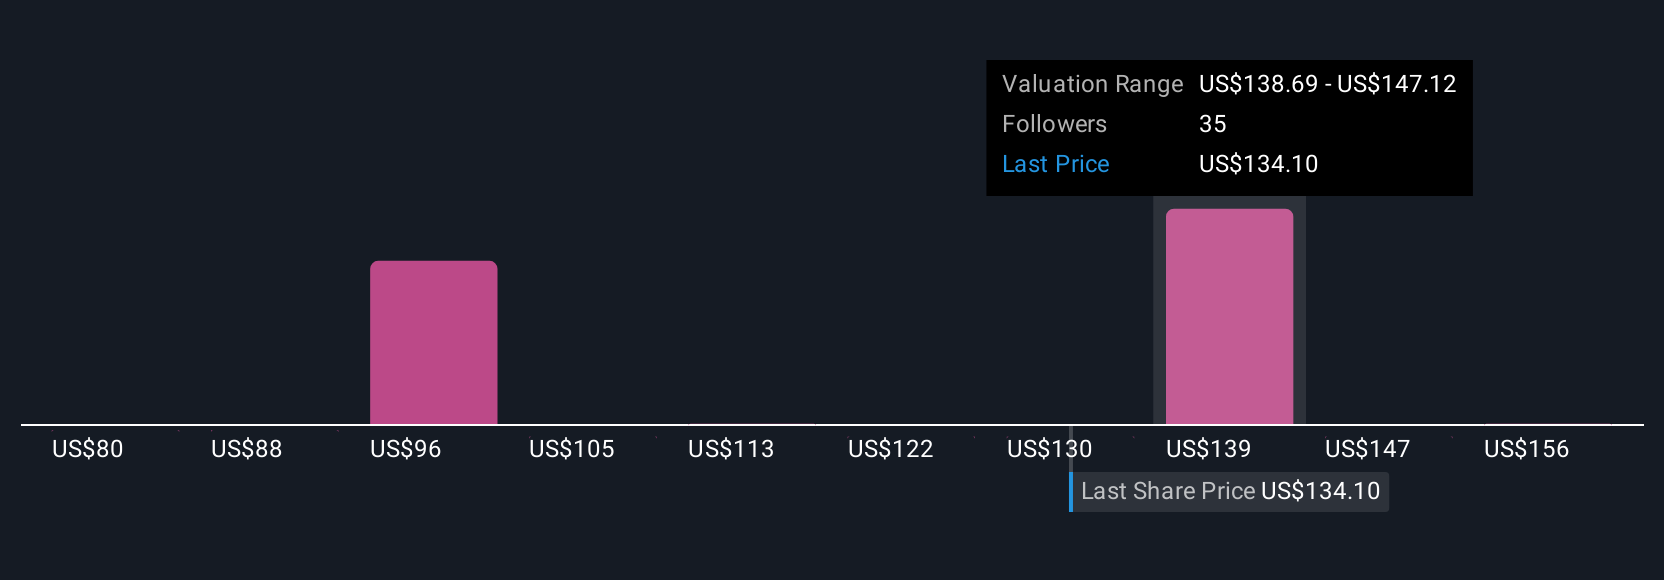
Narratives help you decide when to buy or sell by clearly comparing your fair value (or another investor’s) with the current market price, all while automatically updating as new data, like company news or earnings, comes in. For example, some investors think TJX Companies deserves a premium for ongoing global expansion and set their fair value near the highest price target ($172), while others focus on risks like digital competition or rising costs, resulting in a much lower fair value (as low as $88). This showcases how different perspectives drive distinct investment decisions.
Do you think there's more to the story for TJX Companies? Create your own Narrative to let the Community know!
This article by Simply Wall St is general in nature. We provide commentary based on historical data and analyst forecasts only using an unbiased methodology and our articles are not intended to be financial advice. It does not constitute a recommendation to buy or sell any stock, and does not take account of your objectives, or your financial situation. We aim to bring you long-term focused analysis driven by fundamental data. Note that our analysis may not factor in the latest price-sensitive company announcements or qualitative material. Simply Wall St has no position in any stocks mentioned.
Valuation is complex, but we're here to simplify it.
Discover if TJX Companies might be undervalued or overvalued with our detailed analysis, featuring fair value estimates, potential risks, dividends, insider trades, and its financial condition.
Access Free AnalysisHave feedback on this article? Concerned about the content? Get in touch with us directly. Alternatively, email editorial-team@simplywallst.com
About NYSE:TJX
TJX Companies
Operates as an off-price apparel and home fashions retailer worldwide.
Flawless balance sheet with solid track record.
Similar Companies
Market Insights

Advertisement
Community Narratives
A formidable player in AI and enterprise computing.
Fair Value US$210.00|2.3% overvalued
CO
Community Contributor
IREN's Bold Moves in Sustainable Bitcoin Mining & AI Data Centers
Fair Value US$72.52|17.6% undervalued
BL
Community Contributor
Cooling the Champions: The Aussie Tech Behind F1's Victories
Fair Value AU$12.40|40.4% undervalued
TR
Community Contributor