- United States
- /
- Specialty Stores
- /
- NYSE:GAP
The Gap, Inc.'s (NYSE:GPS) Shares Climb 40% But Its Business Is Yet to Catch Up


The Gap, Inc. (NYSE:GPS) shareholders would be excited to see that the share price has had a great month, posting a 40% gain and recovering from prior weakness. The annual gain comes to 190% following the latest surge, making investors sit up and take notice.
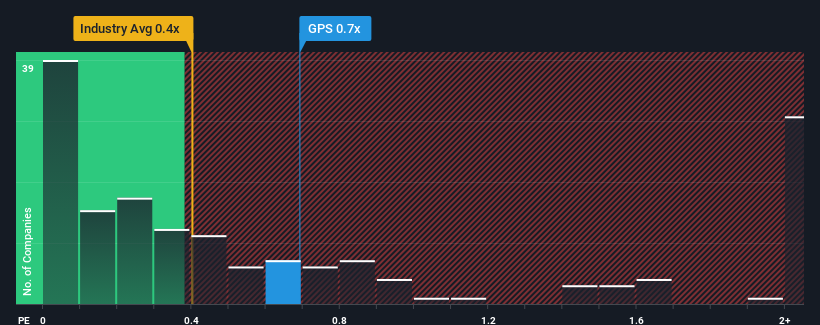
Although its price has surged higher, there still wouldn't be many who think Gap's price-to-sales (or "P/S") ratio of 0.7x is worth a mention when the median P/S in the United States' Specialty Retail industry is similar at about 0.4x. However, investors might be overlooking a clear opportunity or potential setback if there is no rational basis for the P/S.
View our latest analysis for Gap
How Has Gap Performed Recently?
Gap could be doing better as its revenue has been going backwards lately while most other companies have been seeing positive revenue growth. One possibility is that the P/S ratio is moderate because investors think this poor revenue performance will turn around. If not, then existing shareholders may be a little nervous about the viability of the share price.
If you'd like to see what analysts are forecasting going forward, you should check out our free report on Gap.How Is Gap's Revenue Growth Trending?
The only time you'd be comfortable seeing a P/S like Gap's is when the company's growth is tracking the industry closely.
In reviewing the last year of financials, we were disheartened to see the company's revenues fell to the tune of 4.6%. That put a dampener on the good run it was having over the longer-term as its three-year revenue growth is still a noteworthy 7.9% in total. Accordingly, while they would have preferred to keep the run going, shareholders would be roughly satisfied with the medium-term rates of revenue growth.
Looking ahead now, revenue is anticipated to climb by 0.7% per annum during the coming three years according to the analysts following the company. That's shaping up to be materially lower than the 5.7% each year growth forecast for the broader industry.
In light of this, it's curious that Gap's P/S sits in line with the majority of other companies. Apparently many investors in the company are less bearish than analysts indicate and aren't willing to let go of their stock right now. These shareholders may be setting themselves up for future disappointment if the P/S falls to levels more in line with the growth outlook.
What We Can Learn From Gap's P/S?
Its shares have lifted substantially and now Gap's P/S is back within range of the industry median. We'd say the price-to-sales ratio's power isn't primarily as a valuation instrument but rather to gauge current investor sentiment and future expectations.
When you consider that Gap's revenue growth estimates are fairly muted compared to the broader industry, it's easy to see why we consider it unexpected to be trading at its current P/S ratio. When we see companies with a relatively weaker revenue outlook compared to the industry, we suspect the share price is at risk of declining, sending the moderate P/S lower. Circumstances like this present a risk to current and prospective investors who may see share prices fall if the low revenue growth impacts the sentiment.
Before you settle on your opinion, we've discovered 1 warning sign for Gap that you should be aware of.
It's important to make sure you look for a great company, not just the first idea you come across. So if growing profitability aligns with your idea of a great company, take a peek at this free list of interesting companies with strong recent earnings growth (and a low P/E).
New: Manage All Your Stock Portfolios in One Place
We've created the ultimate portfolio companion for stock investors, and it's free.
• Connect an unlimited number of Portfolios and see your total in one currency
• Be alerted to new Warning Signs or Risks via email or mobile
• Track the Fair Value of your stocks
Have feedback on this article? Concerned about the content? Get in touch with us directly. Alternatively, email editorial-team (at) simplywallst.com.
This article by Simply Wall St is general in nature. We provide commentary based on historical data and analyst forecasts only using an unbiased methodology and our articles are not intended to be financial advice. It does not constitute a recommendation to buy or sell any stock, and does not take account of your objectives, or your financial situation. We aim to bring you long-term focused analysis driven by fundamental data. Note that our analysis may not factor in the latest price-sensitive company announcements or qualitative material. Simply Wall St has no position in any stocks mentioned.
About NYSE:GAP
Outstanding track record and good value.

