
Advertisement
- United States
- /
- Specialty Stores
- /
- OTCPK:FTCH.Q
Slammed 61% Farfetch Limited (NYSE:FTCH) Screens Well Here But There Might Be A Catch
The Farfetch Limited (NYSE:FTCH) share price has fared very poorly over the last month, falling by a substantial 61%. For any long-term shareholders, the last month ends a year to forget by locking in a 83% share price decline.
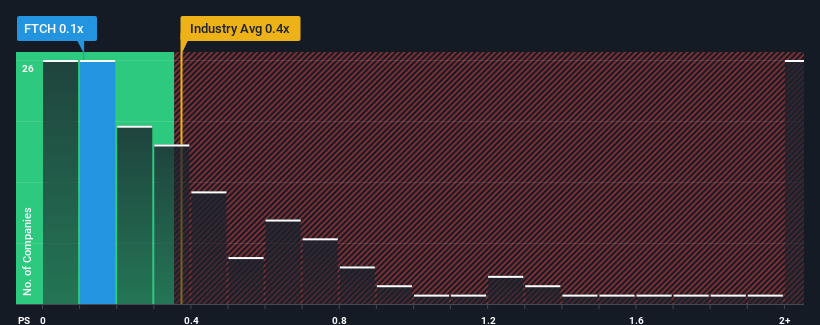
Although its price has dipped substantially, you could still be forgiven for feeling indifferent about Farfetch's P/S ratio of 0.1x, since the median price-to-sales (or "P/S") ratio for the Specialty Retail industry in the United States is also close to 0.4x. However, investors might be overlooking a clear opportunity or potential setback if there is no rational basis for the P/S.
View our latest analysis for Farfetch
What Does Farfetch's P/S Mean For Shareholders?
With revenue growth that's inferior to most other companies of late, Farfetch has been relatively sluggish. One possibility is that the P/S ratio is moderate because investors think this lacklustre revenue performance will turn around. You'd really hope so, otherwise you're paying a relatively elevated price for a company with this sort of growth profile.
Want the full picture on analyst estimates for the company? Then our free report on Farfetch will help you uncover what's on the horizon.Do Revenue Forecasts Match The P/S Ratio?
Farfetch's P/S ratio would be typical for a company that's only expected to deliver moderate growth, and importantly, perform in line with the industry.
If we review the last year of revenue, the company posted a result that saw barely any deviation from a year ago. Although pleasingly revenue has lifted 76% in aggregate from three years ago, notwithstanding the last 12 months. Accordingly, shareholders will be pleased, but also have some questions to ponder about the last 12 months.
Looking ahead now, revenue is anticipated to climb by 15% per year during the coming three years according to the analysts following the company. That's shaping up to be materially higher than the 6.9% per annum growth forecast for the broader industry.
With this information, we find it interesting that Farfetch is trading at a fairly similar P/S compared to the industry. It may be that most investors aren't convinced the company can achieve future growth expectations.
The Key Takeaway
Following Farfetch's share price tumble, its P/S is just clinging on to the industry median P/S. Using the price-to-sales ratio alone to determine if you should sell your stock isn't sensible, however it can be a practical guide to the company's future prospects.
Looking at Farfetch's analyst forecasts revealed that its superior revenue outlook isn't giving the boost to its P/S that we would've expected. Perhaps uncertainty in the revenue forecasts are what's keeping the P/S ratio consistent with the rest of the industry. This uncertainty seems to be reflected in the share price which, while stable, could be higher given the revenue forecasts.
Having said that, be aware Farfetch is showing 3 warning signs in our investment analysis, and 1 of those makes us a bit uncomfortable.
Of course, profitable companies with a history of great earnings growth are generally safer bets. So you may wish to see this free collection of other companies that have reasonable P/E ratios and have grown earnings strongly.
New: AI Stock Screener & Alerts
Our new AI Stock Screener scans the market every day to uncover opportunities.
• Dividend Powerhouses (3%+ Yield)
• Undervalued Small Caps with Insider Buying
• High growth Tech and AI Companies
Or build your own from over 50 metrics.
Have feedback on this article? Concerned about the content? Get in touch with us directly. Alternatively, email editorial-team (at) simplywallst.com.
This article by Simply Wall St is general in nature. We provide commentary based on historical data and analyst forecasts only using an unbiased methodology and our articles are not intended to be financial advice. It does not constitute a recommendation to buy or sell any stock, and does not take account of your objectives, or your financial situation. We aim to bring you long-term focused analysis driven by fundamental data. Note that our analysis may not factor in the latest price-sensitive company announcements or qualitative material. Simply Wall St has no position in any stocks mentioned.
About OTCPK:FTCH.Q
Farfetch
Operates a platform for the luxury fashion industry in the United States, the United Kingdom, and internationally.
Low risk with weak fundamentals.
Similar Companies
Market Insights

Advertisement
Weekly Picks
RO


RockeTeller on Santacruz Silver Mining ·
Crazy Undervalued 42 Baggers Silver Play (Active & Running Mine)
Fair Value:CA$8696.4% undervalued
39 followersusers have followed this narrative
6 commentsusers have commented on this narrative
11 likesusers have liked this narrative
RO


Robbo on Fiducian Group ·
Fiducian: Compliance Clouds or Value Opportunity?
Fair Value:AU$123.8% undervalued
4 followersusers have followed this narrative
0 commentsusers have commented on this narrative
0 likesusers have liked this narrative
WO

woodworthfund on Willamette Valley Vineyards ·
Willamette Valley Vineyards (WVVI): Not-So-Great Value
Fair Value:US$244.5% overvalued
6 followersusers have followed this narrative
0 commentsusers have commented on this narrative
1 likeusers have liked this narrative
Recently Updated Narratives
FU

FundamentallySarcastic on Credit Corp Group ·
Moderation and Stabilisation: HOLD: Fair Price based on a 4-year Cycle is $12.08
Fair Value:AU$12.6411.8% overvalued
2 followersusers have followed this narrative
0 commentsusers have commented on this narrative
0 likesusers have liked this narrative
MA


MarkoVT on Alphabet ·
Positioned globally, partnered locally
Fair Value:US$390.1918.1% undervalued
4 followersusers have followed this narrative
0 commentsusers have commented on this narrative
0 likesusers have liked this narrative
JO


JohnJ on Worldline ·
When will fraudsters be investigated in depth. Fraud was ongoing in France too.
Fair Value:€0.5190.0% overvalued
2 followersusers have followed this narrative
0 commentsusers have commented on this narrative
0 likesusers have liked this narrative
Popular Narratives
TH


TheWallstreetKing on MicroVision ·
MicroVision will explode future revenue by 380.37% with a vision towards success
Fair Value:US$6098.5% undervalued
115 followersusers have followed this narrative
11 commentsusers have commented on this narrative
22 likesusers have liked this narrative
AN


AnalystConsensusTarget on NVIDIA ·
NVDA: Expanding AI Demand Will Drive Major Data Center Investments Through 2026
Fair Value:US$250.3928.3% undervalued
952 followersusers have followed this narrative
6 commentsusers have commented on this narrative
25 likesusers have liked this narrative
OS

oscargarcia on Alphabet ·
The company that turned a verb into a global necessity and basically runs the modern internet, digital ads, smartphones, maps, and AI.
Fair Value:US$3406.0% undervalued
147 followersusers have followed this narrative
6 commentsusers have commented on this narrative
18 likesusers have liked this narrative

