- United States
- /
- Specialty Stores
- /
- OTCPK:FTCH.Q
Positive Sentiment Still Eludes Farfetch Limited (NYSE:FTCH) Following 47% Share Price Slump
Farfetch Limited (NYSE:FTCH) shares have had a horrible month, losing 47% after a relatively good period beforehand. The recent drop completes a disastrous twelve months for shareholders, who are sitting on a 76% loss during that time.
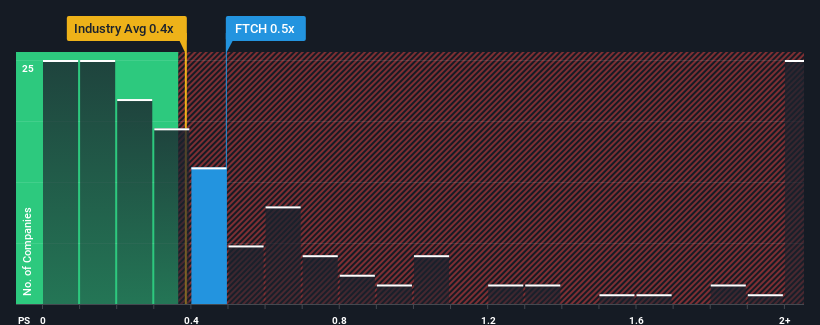
Even after such a large drop in price, there still wouldn't be many who think Farfetch's price-to-sales (or "P/S") ratio of 0.5x is worth a mention when the median P/S in the United States' Specialty Retail industry is similar at about 0.4x. Although, it's not wise to simply ignore the P/S without explanation as investors may be disregarding a distinct opportunity or a costly mistake.
See our latest analysis for Farfetch

What Does Farfetch's P/S Mean For Shareholders?
Recent times haven't been great for Farfetch as its revenue has been rising slower than most other companies. It might be that many expect the uninspiring revenue performance to strengthen positively, which has kept the P/S ratio from falling. You'd really hope so, otherwise you're paying a relatively elevated price for a company with this sort of growth profile.
Want the full picture on analyst estimates for the company? Then our free report on Farfetch will help you uncover what's on the horizon.What Are Revenue Growth Metrics Telling Us About The P/S?
Farfetch's P/S ratio would be typical for a company that's only expected to deliver moderate growth, and importantly, perform in line with the industry.
Retrospectively, the last year delivered virtually the same number to the company's top line as the year before. Still, the latest three year period has seen an excellent 76% overall rise in revenue, in spite of its uninspiring short-term performance. So while the company has done a solid job in the past, it's somewhat concerning to see revenue growth decline as much as it has.
Looking ahead now, revenue is anticipated to climb by 16% per annum during the coming three years according to the analysts following the company. With the industry only predicted to deliver 6.8% per year, the company is positioned for a stronger revenue result.
With this in consideration, we find it intriguing that Farfetch's P/S is closely matching its industry peers. It may be that most investors aren't convinced the company can achieve future growth expectations.
What We Can Learn From Farfetch's P/S?
Following Farfetch's share price tumble, its P/S is just clinging on to the industry median P/S. Typically, we'd caution against reading too much into price-to-sales ratios when settling on investment decisions, though it can reveal plenty about what other market participants think about the company.
We've established that Farfetch currently trades on a lower than expected P/S since its forecasted revenue growth is higher than the wider industry. There could be some risks that the market is pricing in, which is preventing the P/S ratio from matching the positive outlook. At least the risk of a price drop looks to be subdued, but investors seem to think future revenue could see some volatility.
It is also worth noting that we have found 3 warning signs for Farfetch (1 is a bit concerning!) that you need to take into consideration.
If companies with solid past earnings growth is up your alley, you may wish to see this free collection of other companies with strong earnings growth and low P/E ratios.
New: AI Stock Screener & Alerts
Our new AI Stock Screener scans the market every day to uncover opportunities.
• Dividend Powerhouses (3%+ Yield)
• Undervalued Small Caps with Insider Buying
• High growth Tech and AI Companies
Or build your own from over 50 metrics.
Have feedback on this article? Concerned about the content? Get in touch with us directly. Alternatively, email editorial-team (at) simplywallst.com.
This article by Simply Wall St is general in nature. We provide commentary based on historical data and analyst forecasts only using an unbiased methodology and our articles are not intended to be financial advice. It does not constitute a recommendation to buy or sell any stock, and does not take account of your objectives, or your financial situation. We aim to bring you long-term focused analysis driven by fundamental data. Note that our analysis may not factor in the latest price-sensitive company announcements or qualitative material. Simply Wall St has no position in any stocks mentioned.
About OTCPK:FTCH.Q
Farfetch
Operates a platform for the luxury fashion industry in the United States, the United Kingdom, and internationally.
Low risk with weak fundamentals.
Similar Companies
Market Insights
Weekly Picks


Crazy Undervalued 42 Baggers Silver Play (Active & Running Mine)


Fiducian: Compliance Clouds or Value Opportunity?

Willamette Valley Vineyards (WVVI): Not-So-Great Value
Recently Updated Narratives

Moderation and Stabilisation: HOLD: Fair Price based on a 4-year Cycle is $12.08


Positioned globally, partnered locally


When will fraudsters be investigated in depth. Fraud was ongoing in France too.
Popular Narratives


MicroVision will explode future revenue by 380.37% with a vision towards success


NVDA: Expanding AI Demand Will Drive Major Data Center Investments Through 2026


