Advertisement
Sizing Up Dillard’s After a 70.6% Stock Surge: What Are Shares Really Worth?

Simply Wall St
Reviewed by Bailey Pemberton
If you have been watching Dillard's stock, you know just how dramatic the journey has been. Over the past five years, shares have surged by a jaw-dropping 1552.4%, far outpacing most retailers and raising more than a few eyebrows on Wall Street. That momentum has hardly fizzled out; in just the past year, the stock advanced 70.6%. Even shorter-term moves are encouraging, with the last month alone producing a solid 5.6% gain.
Behind these headline numbers, recent market optimism seems to have been fueled by a steady focus on optimizing inventory and a disciplined approach to controlling costs. Dillard's management has doubled down on prudent store operations rather than rapid expansion, a choice many believe has helped the retailer stay resilient despite shifting consumer spending patterns. There has also been ongoing speculation about how the company might leverage its strong real estate portfolio. This is a factor some analysts think could unlock further shareholder value in the future.
When it comes to valuation, though, the picture gets a bit more nuanced. By our scoring system, Dillard's logs a value score of 2 out of 6, indicating the company is undervalued on two fronts but fails to hit the mark on four others. What does this score really mean for investors weighing their next move? To answer that, let’s break down each valuation method in detail, and later, I will share a more comprehensive approach that might just change how you size up this retailer altogether.
Dillard's scores just 2/6 on our valuation checks. See what other red flags we found in the full valuation breakdown.
Approach 1: Dillard's Discounted Cash Flow (DCF) Analysis
The Discounted Cash Flow (DCF) model is a widely used method for estimating a company's intrinsic value by projecting its future cash flows and discounting them back to their present value using a required rate of return. This approach aims to give investors a sense of what the business is truly worth based on its ability to generate free cash flow over time.
For Dillard’s, the current last twelve months free cash flow stands at $747 million. Projections suggest that free cash flow will fluctuate over the coming years, with a notable dip by 2027 to $511 million before gradually climbing again. Beyond the five-year timeline where analyst estimates end, further cash flow projections are extrapolated, reaching approximately $578 million in 2035. These figures highlight some expected volatility along with an overall positive long-term trend in cash generation.
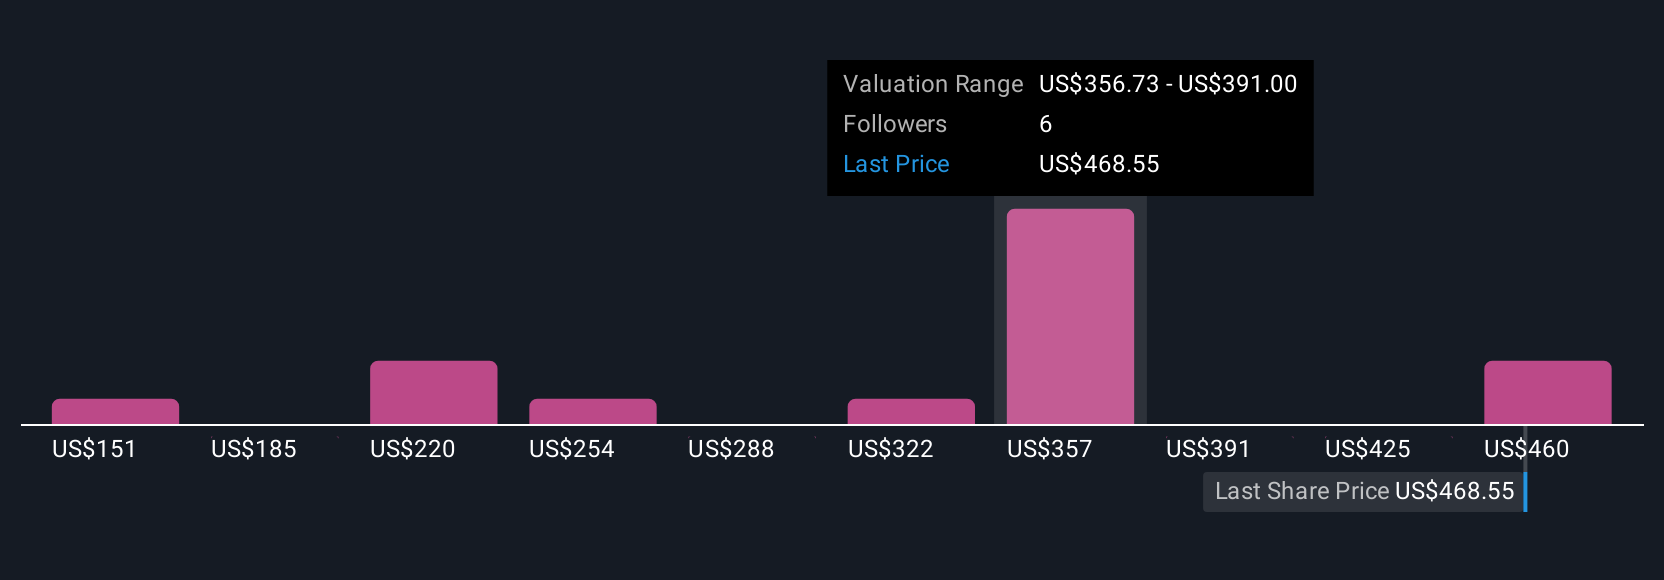
According to the DCF analysis, Dillard’s estimated intrinsic value is $563.56 per share. Comparing this with the current share price, the stock is about 7.5% overvalued by this model's calculation. In other words, although Dillard’s underlying business is strong, the market price is currently running a little ahead of what the company’s future cash flows justify.
Result: ABOUT RIGHT

Simply Wall St performs a valuation analysis on every stock in the world every day (check out Dillard's's valuation analysis). We show the entire calculation in full. You can track the result in your watchlist or portfolio and be alerted when this changes.
Approach 2: Dillard's Price vs Earnings
The price-to-earnings (PE) ratio is a time-tested valuation tool, especially for established, profitable companies like Dillard’s. It tells investors how much they are paying for each dollar of earnings, a metric that bridges company performance with market expectations.
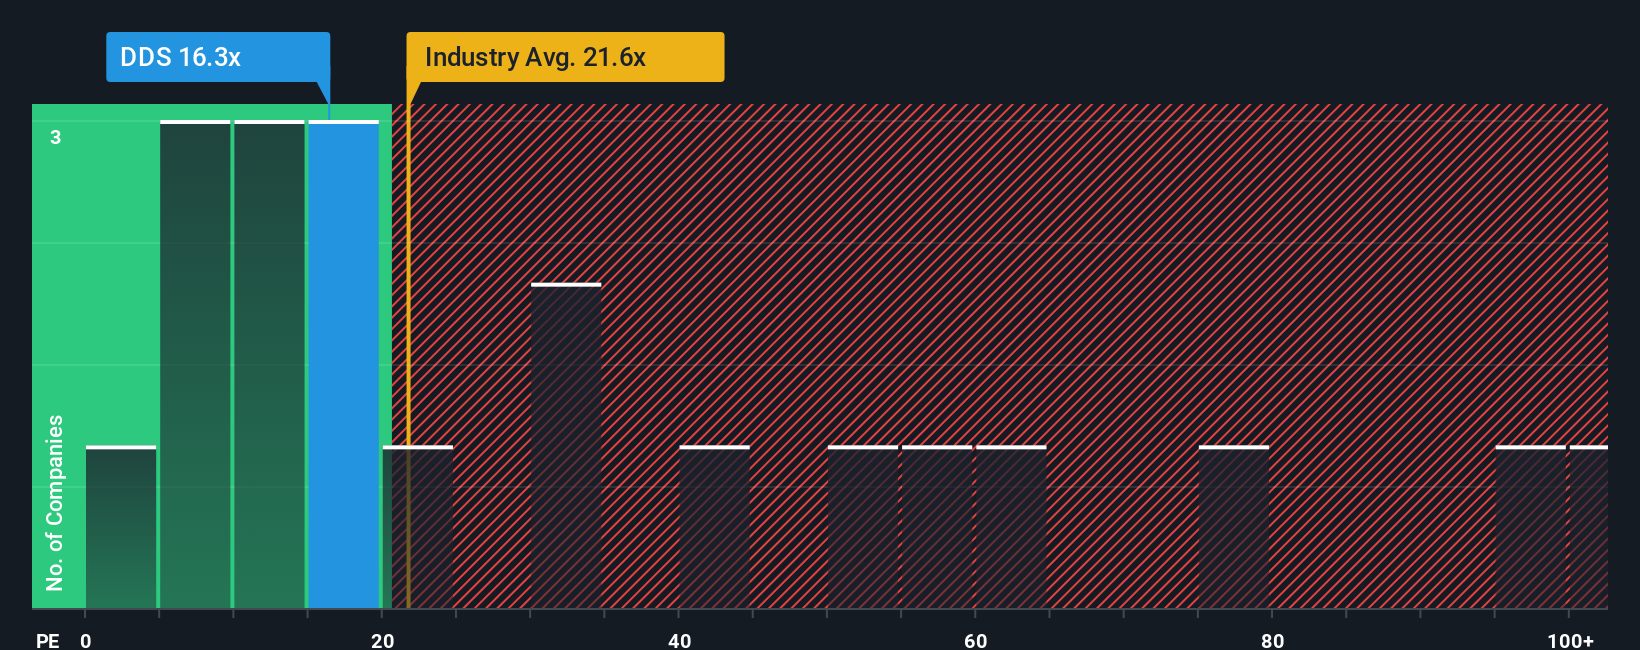
Whether a “normal” or “fair” PE ratio is high or low depends on a company’s growth outlook and risk profile. Strong growth prospects or a stable earnings base typically justify a higher PE, while greater risks or slower growth call for lower multiples. For context, Dillard’s current PE sits at 16.4x. This is more conservative than the industry average PE of 21.6x, and it is also materially below its peer group, which posts a 24.6x average.
To refine this further, Simply Wall St’s proprietary Fair Ratio approach estimates what Dillard’s PE should be, taking into account the company’s growth, risk, profit margins, industry, and market capitalization. This model produces a Fair Ratio of 10.2x for Dillard’s, significantly lower than industry and peer averages, reflecting more precise, company-specific factors. Because the current PE of 16.4x is well above this Fair Ratio, it suggests the stock is priced on the higher side relative to its fundamentals, even after accounting for growth and inherent risks.
Result: OVERVALUED
PE ratios tell one story, but what if the real opportunity lies elsewhere? Discover companies where insiders are betting big on explosive growth.
Upgrade Your Decision Making: Choose your Dillard's Narrative
Earlier we mentioned that there is an even better way to understand valuation, so let’s introduce you to Narratives. A Narrative is your investment story for a company, combining your unique view on what Dillard’s future could look like with the financial forecasts and fair value calculations that support it.
Narratives let you turn your perspective on Dillard’s revenue growth, profit margins, or business strategy into an actionable forecast, linking the company’s story to the numbers that matter. On Simply Wall St’s platform, Narratives are easy to use and accessible from the Community page, used by millions of investors to share and refine their outlooks.
By crafting a Narrative, you can quickly see if your fair value for Dillard’s is above or below the current price and make more confident buy or sell decisions. Narratives are dynamically updated as new information, such as earnings reports or breaking news, is released, so your analysis always stays relevant.
For example, some investors in the Community believe Dillard’s fair value is much higher than today’s price, while others see it as much lower. This shows how different Narratives can shape your investment approach.
Do you think there's more to the story for Dillard's? Create your own Narrative to let the Community know!
This article by Simply Wall St is general in nature. We provide commentary based on historical data and analyst forecasts only using an unbiased methodology and our articles are not intended to be financial advice. It does not constitute a recommendation to buy or sell any stock, and does not take account of your objectives, or your financial situation. We aim to bring you long-term focused analysis driven by fundamental data. Note that our analysis may not factor in the latest price-sensitive company announcements or qualitative material. Simply Wall St has no position in any stocks mentioned.
New: Manage All Your Stock Portfolios in One Place
We've created the ultimate portfolio companion for stock investors, and it's free.
• Connect an unlimited number of Portfolios and see your total in one currency
• Be alerted to new Warning Signs or Risks via email or mobile
• Track the Fair Value of your stocks
Have feedback on this article? Concerned about the content? Get in touch with us directly. Alternatively, email editorial-team@simplywallst.com
About NYSE:DDS
Dillard's
Operates retail department stores in the southeastern, southwestern, and midwestern areas of the United States.
Flawless balance sheet established dividend payer.
Similar Companies
Market Insights

Advertisement
Community Narratives
Finding The True Value Of A Logistics Powerhouse
Fair Value US$95.21|8.5% undervalued
NV
Community Contributor
Paradigm Biopharmaceuticals Will Lead Osteoarthritis Treatment with Zilosul's FDA Success
Fair Value AU$5.50|91.8% undervalued
AM
Community Contributor
Barrick Mining (ABX:CA): A Gold Hedge against a U.S. Shutdown
Fair Value CA$60.00|26.5% undervalued
GM
Community Contributor