- United States
- /
- Specialty Stores
- /
- NYSE:CURV
Torrid Holdings (NYSE:CURV) Might Become A Compounding Machine

Finding a business that has the potential to grow substantially is not easy, but it is possible if we look at a few key financial metrics. Firstly, we'll want to see a proven return on capital employed (ROCE) that is increasing, and secondly, an expanding base of capital employed. Basically this means that a company has profitable initiatives that it can continue to reinvest in, which is a trait of a compounding machine. With that in mind, the ROCE of Torrid Holdings (NYSE:CURV) looks attractive right now, so lets see what the trend of returns can tell us.
Return On Capital Employed (ROCE): What Is It?
Just to clarify if you're unsure, ROCE is a metric for evaluating how much pre-tax income (in percentage terms) a company earns on the capital invested in its business. The formula for this calculation on Torrid Holdings is:
Return on Capital Employed = Earnings Before Interest and Tax (EBIT) ÷ (Total Assets - Current Liabilities)
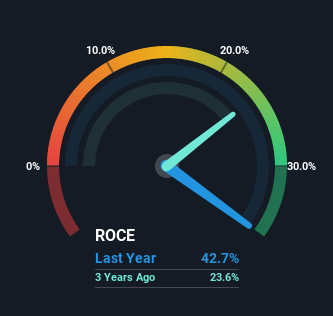
0.43 = US$115m ÷ (US$564m - US$295m) (Based on the trailing twelve months to October 2022).
Thus, Torrid Holdings has an ROCE of 43%. That's a fantastic return and not only that, it outpaces the average of 17% earned by companies in a similar industry.
View our latest analysis for Torrid Holdings
Above you can see how the current ROCE for Torrid Holdings compares to its prior returns on capital, but there's only so much you can tell from the past. If you'd like to see what analysts are forecasting going forward, you should check out our free report for Torrid Holdings.
What Does the ROCE Trend For Torrid Holdings Tell Us?
In terms of Torrid Holdings' history of ROCE, it's quite impressive. Over the past four years, ROCE has remained relatively flat at around 43% and the business has deployed 41% more capital into its operations. With returns that high, it's great that the business can continually reinvest its money at such appealing rates of return. You'll see this when looking at well operated businesses or favorable business models.
Another point to note, we noticed the company has increased current liabilities over the last four years. This is intriguing because if current liabilities hadn't increased to 52% of total assets, this reported ROCE would probably be less than43% because total capital employed would be higher.The 43% ROCE could be even lower if current liabilities weren't 52% of total assets, because the the formula would show a larger base of total capital employed. So with current liabilities at such high levels, this effectively means the likes of suppliers or short-term creditors are funding a meaningful part of the business, which in some instances can bring some risks.
Our Take On Torrid Holdings' ROCE
In the end, the company has proven it can reinvest it's capital at high rates of returns, which you'll remember is a trait of a multi-bagger. However, despite the favorable fundamentals, the stock has fallen 61% over the last year, so there might be an opportunity here for astute investors. For that reason, savvy investors might want to look further into this company in case it's a prime investment.
Since virtually every company faces some risks, it's worth knowing what they are, and we've spotted 3 warning signs for Torrid Holdings (of which 2 are concerning!) that you should know about.
If you'd like to see other companies earning high returns, check out our free list of companies earning high returns with solid balance sheets here.
Valuation is complex, but we're here to simplify it.
Discover if Torrid Holdings might be undervalued or overvalued with our detailed analysis, featuring fair value estimates, potential risks, dividends, insider trades, and its financial condition.
Access Free AnalysisHave feedback on this article? Concerned about the content? Get in touch with us directly. Alternatively, email editorial-team (at) simplywallst.com.
This article by Simply Wall St is general in nature. We provide commentary based on historical data and analyst forecasts only using an unbiased methodology and our articles are not intended to be financial advice. It does not constitute a recommendation to buy or sell any stock, and does not take account of your objectives, or your financial situation. We aim to bring you long-term focused analysis driven by fundamental data. Note that our analysis may not factor in the latest price-sensitive company announcements or qualitative material. Simply Wall St has no position in any stocks mentioned.
About NYSE:CURV
Torrid Holdings
Operates in women’s plus-size apparel and intimates market in North America.
Proven track record with moderate growth potential.
