Advertisement
- United States
- /
- Specialty Stores
- /
- NYSE:ABG
Does Asbury Still Offer Value After Its Latest Stock Rally in 2025?

Simply Wall St
Reviewed by Bailey Pemberton
If you’re weighing your next move with Asbury Automotive Group, you’re definitely not alone. The stock just closed at $243.74, and its performance hasn't exactly been sleepy. In the last week, shares popped up 3.7% while holding onto a modest 0.4% gain over the past month. Year to date, Asbury has climbed 3.1%, and if you zoom out to a one-year view, you’ll see it’s up 3.9%. The real jaw-dropper is that over the last three years, returns have soared a whopping 70.3%, and over five years, the stock has more than doubled with a gain of 104.9%.
This kind of long-term story naturally gets investors wondering: Is there still value to unlock here, or has the easy growth already been realized? A closer look at the numbers suggests Asbury may still be flying a bit under the radar. According to our latest analysis, the company earns a valuation score of 5 out of 6, meaning it checks almost all the boxes for being undervalued.
So how does Asbury look through the lens of different valuation methods? Let’s walk through the usual playbook, and then share a fresh perspective that could make your view on valuation even sharper.
Why Asbury Automotive Group is lagging behind its peers
Approach 1: Asbury Automotive Group Discounted Cash Flow (DCF) Analysis
A Discounted Cash Flow (DCF) model estimates a stock's intrinsic value by projecting its future cash flows and discounting them back to today. This helps investors assess what the company is fundamentally worth, based on expected future performance rather than recent price moves.
Asbury Automotive Group currently generates Free Cash Flow (FCF) of $814.3 Million. Analyst estimates cover the next several years, with expectations that FCF will reach $841 Million by the end of 2027. Beyond that, projections are extrapolated and suggest FCF could be around $720.9 Million in 2035. These projections are based on a two-stage Free Cash Flow to Equity model, blending analyst insight with longer-term forecasting.
Using these cash flow forecasts and discounting them to their present value, the DCF analysis arrives at an intrinsic value of $415.14 per share. Compared to the recent share price of $243.74, this calculation suggests that Asbury stock is trading at a substantial 41.3% discount to its fair value. This points to an undervalued opportunity based on the underlying cash flows.
Result: UNDERVALUED
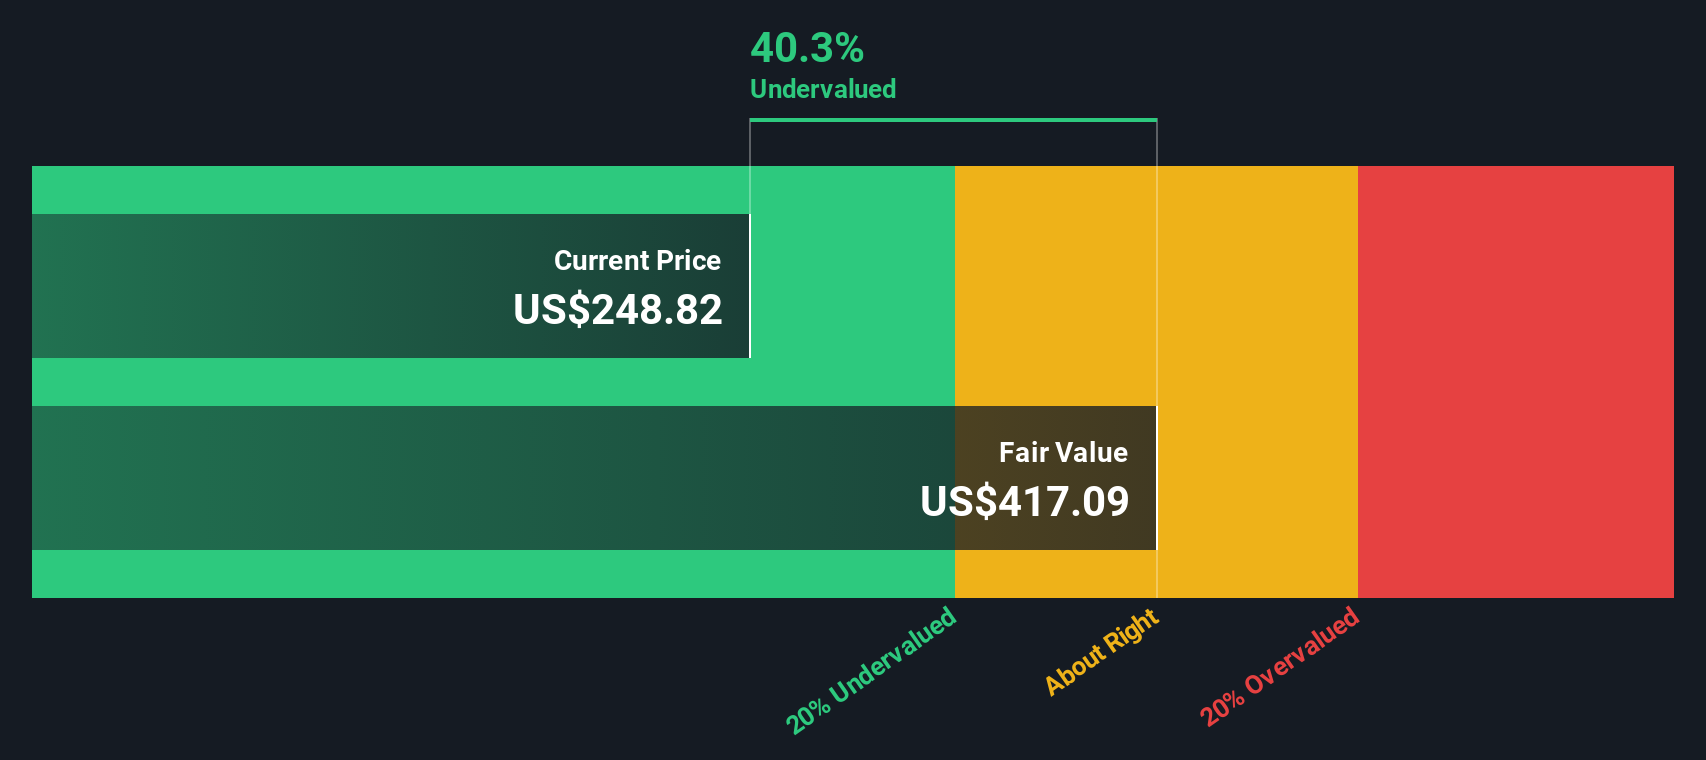
Our Discounted Cash Flow (DCF) analysis suggests Asbury Automotive Group is undervalued by 41.3%. Track this in your watchlist or portfolio, or discover more undervalued stocks.
Approach 2: Asbury Automotive Group Price vs Earnings
For profitable companies like Asbury Automotive Group, the price-to-earnings (PE) ratio stands out as a go-to metric for gauging valuation. It provides a snapshot of how much investors are willing to pay for each dollar of current earnings, making it a popular and intuitive tool for comparing companies within the same industry.
The "right" PE ratio for any stock depends not just on where it sits compared to peers, but also on its expected growth and risk profile. High-growth companies or those seen as less risky tend to command higher PE ratios, while slower growth or greater uncertainty usually leads to a lower multiple.
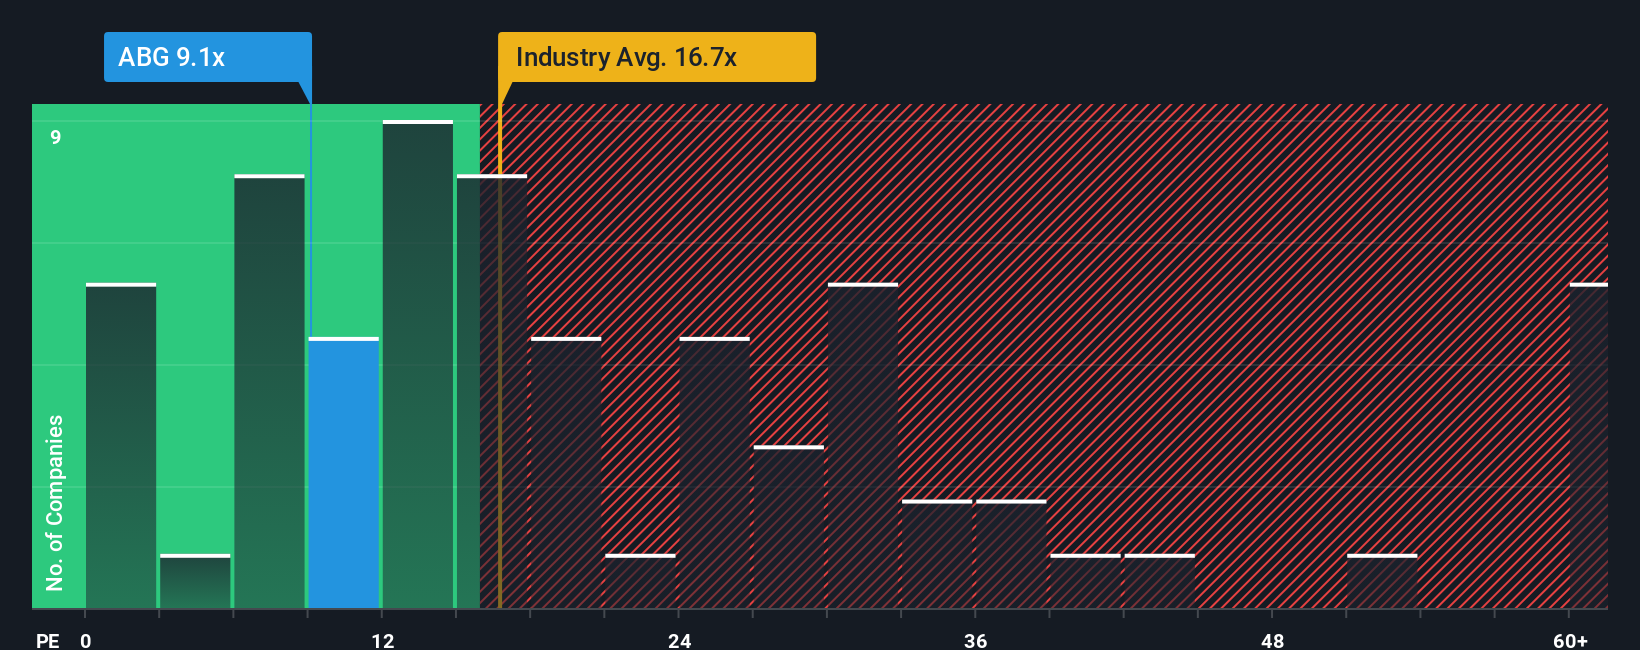
Currently, Asbury trades at a PE ratio of 8.87x. When stacked against the Specialty Retail industry average of 16.14x and a peer average of 12.16x, Asbury is clearly trading at a substantial discount. But raw comparisons can miss a lot of nuance. That is where our proprietary Fair Ratio comes in. Simply Wall St's Fair Ratio is calculated by weighing factors like Asbury’s historical and projected earnings growth, profit margins, industry positioning, potential risks, and market capitalization. This results in a more tailored benchmark for whether the current valuation actually makes sense for this particular business.
For Asbury, the Fair Ratio lands at 15.08x, notably above both the company’s current multiple and its peer average. Because the Fair Ratio adjusts for Asbury’s specific strengths and risks, the gap between the current PE and fair multiple points clearly to undervaluation. In other words, the market appears to be giving investors a bargain compared to what the fundamentals suggest is appropriate.
Result: UNDERVALUED
PE ratios tell one story, but what if the real opportunity lies elsewhere? Discover companies where insiders are betting big on explosive growth.
Upgrade Your Decision Making: Choose your Asbury Automotive Group Narrative
Earlier, we mentioned that there is an even better way to understand valuation. Let’s introduce you to Narratives. A Narrative is a story that you create about a company—your perspective on how its business will perform in the future, grounded in your own forecasts for fair value, revenue growth, earnings, and profit margins. Narratives connect the dots between a company’s story, a financial forecast, and an estimate of fair value. This approach makes numbers more meaningful by backing them with real-world expectations.
Simply Wall St’s platform makes it easy to craft and update your Narrative in just a few minutes through the Community page, where millions of investors share and compare their views. Narratives help you decide when a stock like Asbury is worth buying or selling by showing how your Fair Value stacks up against the current Price, and they automatically update as new announcements and earnings come in.
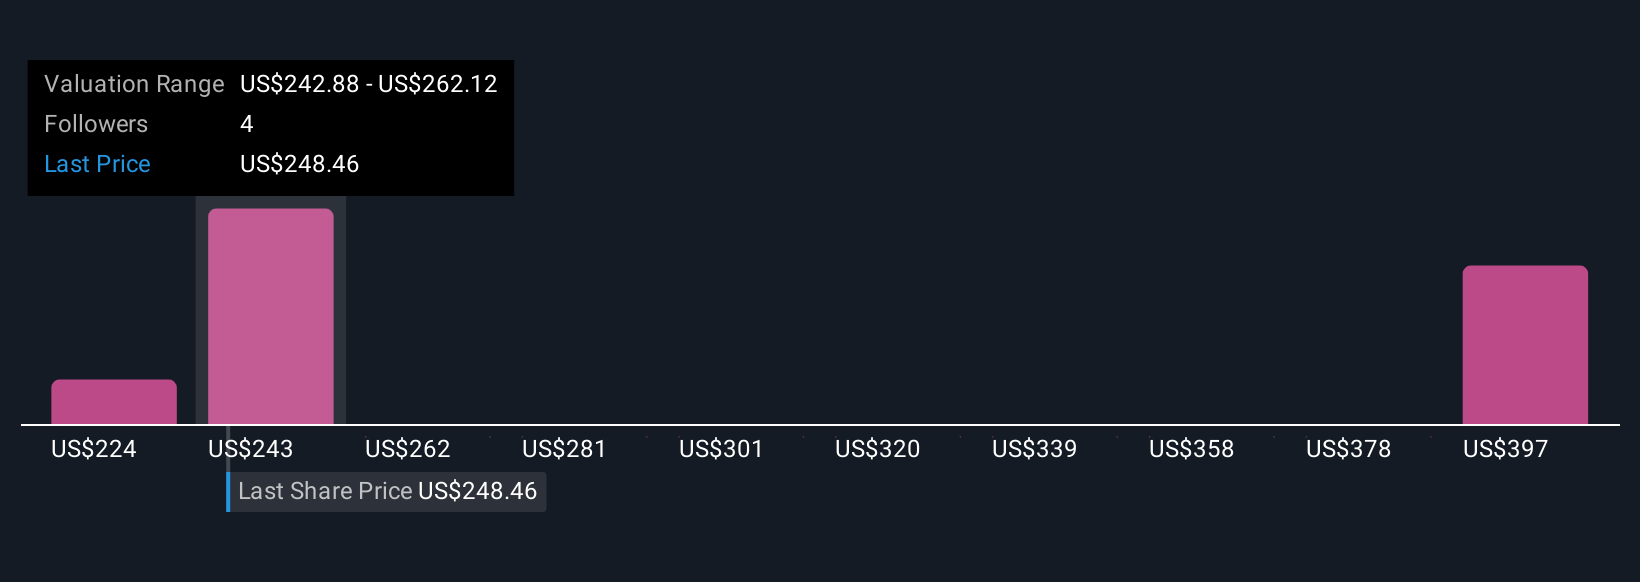
For example, some investors might create a bullish Narrative for Asbury Automotive Group, expecting future expansion into luxury markets and digital retail to boost fair value as high as $335 per share. Others might highlight risks from acquisitions and evolving industry trends, leading to a more cautious fair value nearer $215. Narratives let you test your own assumptions and see how they compare to the wider market.
Do you think there's more to the story for Asbury Automotive Group? Create your own Narrative to let the Community know!
This article by Simply Wall St is general in nature. We provide commentary based on historical data and analyst forecasts only using an unbiased methodology and our articles are not intended to be financial advice. It does not constitute a recommendation to buy or sell any stock, and does not take account of your objectives, or your financial situation. We aim to bring you long-term focused analysis driven by fundamental data. Note that our analysis may not factor in the latest price-sensitive company announcements or qualitative material. Simply Wall St has no position in any stocks mentioned.
New: Manage All Your Stock Portfolios in One Place
We've created the ultimate portfolio companion for stock investors, and it's free.
• Connect an unlimited number of Portfolios and see your total in one currency
• Be alerted to new Warning Signs or Risks via email or mobile
• Track the Fair Value of your stocks
Have feedback on this article? Concerned about the content? Get in touch with us directly. Alternatively, email editorial-team@simplywallst.com
About NYSE:ABG
Asbury Automotive Group
Operates as an automotive retailer in the United States.
Undervalued with solid track record.
Similar Companies
Market Insights

Advertisement
Community Narratives
Kodiak AI - a potential 100 bagger opportunity?
Fair Value US$14.00|44.7% undervalued
DA
Community Contributor
A Fair Price for a Great Business Facing Real Threats
Fair Value US$383.06|13.0% undervalued
IM
Community Contributor
AXON And Shopify Integration Will Unlock Global Mobile Advertising
Fair Value US$646.30|0% overvalued
AN
Based on Analyst Price Targets