
Advertisement
- United States
- /
- Specialty Stores
- /
- NYSE:AAP
More Unpleasant Surprises Could Be In Store For Advance Auto Parts, Inc.'s (NYSE:AAP) Shares After Tumbling 27%
Advance Auto Parts, Inc. (NYSE:AAP) shareholders won't be pleased to see that the share price has had a very rough month, dropping 27% and undoing the prior period's positive performance. The drop over the last 30 days has capped off a tough year for shareholders, with the share price down 49% in that time.
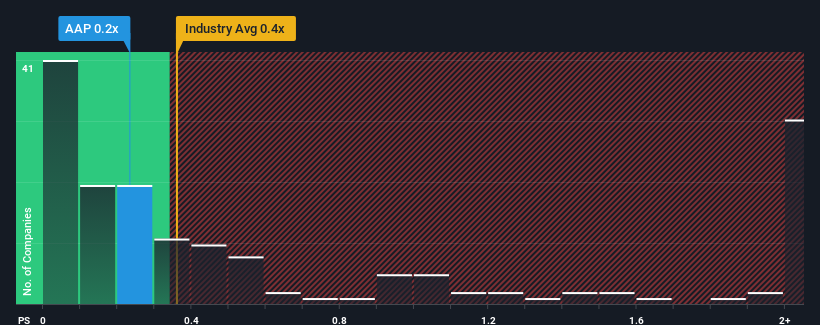
Even after such a large drop in price, it's still not a stretch to say that Advance Auto Parts' price-to-sales (or "P/S") ratio of 0.2x right now seems quite "middle-of-the-road" compared to the Specialty Retail industry in the United States, where the median P/S ratio is around 0.4x. While this might not raise any eyebrows, if the P/S ratio is not justified investors could be missing out on a potential opportunity or ignoring looming disappointment.
View our latest analysis for Advance Auto Parts
How Has Advance Auto Parts Performed Recently?
Advance Auto Parts hasn't been tracking well recently as its declining revenue compares poorly to other companies, which have seen some growth in their revenues on average. Perhaps the market is expecting its poor revenue performance to improve, keeping the P/S from dropping. However, if this isn't the case, investors might get caught out paying too much for the stock.
If you'd like to see what analysts are forecasting going forward, you should check out our free report on Advance Auto Parts.Is There Some Revenue Growth Forecasted For Advance Auto Parts?
The only time you'd be comfortable seeing a P/S like Advance Auto Parts' is when the company's growth is tracking the industry closely.
Retrospectively, the last year delivered a frustrating 1.4% decrease to the company's top line. The last three years don't look nice either as the company has shrunk revenue by 17% in aggregate. Accordingly, shareholders would have felt downbeat about the medium-term rates of revenue growth.
Turning to the outlook, the next three years should bring diminished returns, with revenue decreasing 1.2% per annum as estimated by the analysts watching the company. Meanwhile, the broader industry is forecast to expand by 5.8% per year, which paints a poor picture.
In light of this, it's somewhat alarming that Advance Auto Parts' P/S sits in line with the majority of other companies. It seems most investors are hoping for a turnaround in the company's business prospects, but the analyst cohort is not so confident this will happen. There's a good chance these shareholders are setting themselves up for future disappointment if the P/S falls to levels more in line with the negative growth outlook.
What We Can Learn From Advance Auto Parts' P/S?
Advance Auto Parts' plummeting stock price has brought its P/S back to a similar region as the rest of the industry. Typically, we'd caution against reading too much into price-to-sales ratios when settling on investment decisions, though it can reveal plenty about what other market participants think about the company.
Our check of Advance Auto Parts' analyst forecasts revealed that its outlook for shrinking revenue isn't bringing down its P/S as much as we would have predicted. With this in mind, we don't feel the current P/S is justified as declining revenues are unlikely to support a more positive sentiment for long. If the poor revenue outlook tells us one thing, it's that these current price levels could be unsustainable.
You always need to take note of risks, for example - Advance Auto Parts has 1 warning sign we think you should be aware of.
If strong companies turning a profit tickle your fancy, then you'll want to check out this free list of interesting companies that trade on a low P/E (but have proven they can grow earnings).
New: Manage All Your Stock Portfolios in One Place
We've created the ultimate portfolio companion for stock investors, and it's free.
• Connect an unlimited number of Portfolios and see your total in one currency
• Be alerted to new Warning Signs or Risks via email or mobile
• Track the Fair Value of your stocks
Have feedback on this article? Concerned about the content? Get in touch with us directly. Alternatively, email editorial-team (at) simplywallst.com.
This article by Simply Wall St is general in nature. We provide commentary based on historical data and analyst forecasts only using an unbiased methodology and our articles are not intended to be financial advice. It does not constitute a recommendation to buy or sell any stock, and does not take account of your objectives, or your financial situation. We aim to bring you long-term focused analysis driven by fundamental data. Note that our analysis may not factor in the latest price-sensitive company announcements or qualitative material. Simply Wall St has no position in any stocks mentioned.
About NYSE:AAP
Advance Auto Parts
Engages in the provision of automotive aftermarket parts in the United States and internationally.
Good value with moderate growth potential.
Similar Companies
Market Insights

Advertisement
Community Narratives
Kodiak AI - a potential 100 bagger opportunity?
Fair Value US$14.00|44.7% undervalued
DA
Community Contributor
A Fair Price for a Great Business Facing Real Threats
Fair Value US$383.06|13.0% undervalued
IM
Community Contributor
AXON And Shopify Integration Will Unlock Global Mobile Advertising
Fair Value US$646.30|0% overvalued
AN
Based on Analyst Price Targets