
Advertisement
Here's Why We're A Bit Worried About Yunji's (NASDAQ:YJ) Cash Burn Situation
Even when a business is losing money, it's possible for shareholders to make money if they buy a good business at the right price. For example, although software-as-a-service business Salesforce.com lost money for years while it grew recurring revenue, if you held shares since 2005, you'd have done very well indeed. But while the successes are well known, investors should not ignore the very many unprofitable companies that simply burn through all their cash and collapse.
So, the natural question for Yunji (NASDAQ:YJ) shareholders is whether they should be concerned by its rate of cash burn. For the purposes of this article, cash burn is the annual rate at which an unprofitable company spends cash to fund its growth; its negative free cash flow. The first step is to compare its cash burn with its cash reserves, to give us its 'cash runway'.
See our latest analysis for Yunji
When Might Yunji Run Out Of Money?
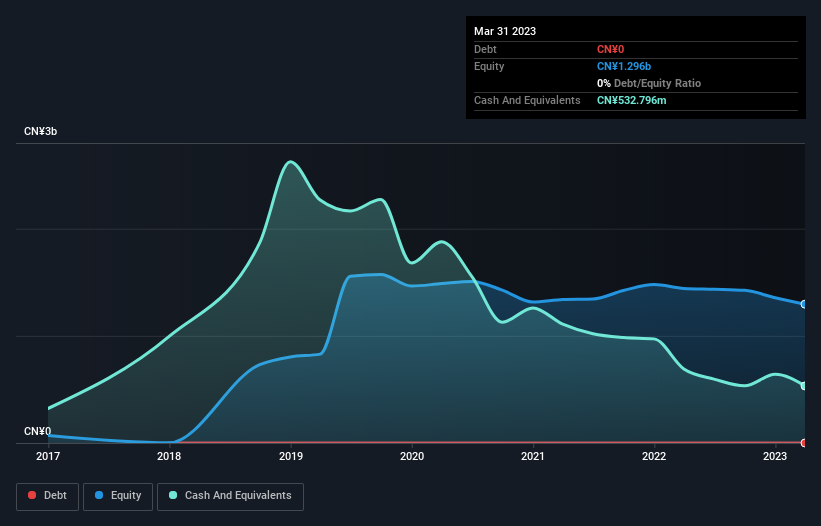
A company's cash runway is calculated by dividing its cash hoard by its cash burn. When Yunji last reported its balance sheet in March 2023, it had zero debt and cash worth CN¥533m. Importantly, its cash burn was CN¥309m over the trailing twelve months. So it had a cash runway of approximately 21 months from March 2023. While that cash runway isn't too concerning, sensible holders would be peering into the distance, and considering what happens if the company runs out of cash. Depicted below, you can see how its cash holdings have changed over time.
How Well Is Yunji Growing?
Yunji boosted investment sharply in the last year, with cash burn ramping by 92%. While that's concerning on it's own, the fact that operating revenue was actually down 46% over the same period makes us positively tremulous. In light of the above-mentioned, we're pretty wary of the trajectory the company seems to be on. In reality, this article only makes a short study of the company's growth data. This graph of historic earnings and revenue shows how Yunji is building its business over time.
Can Yunji Raise More Cash Easily?
Since Yunji can't yet boast improving growth metrics, the market will likely be considering how it can raise more cash if need be. Companies can raise capital through either debt or equity. One of the main advantages held by publicly listed companies is that they can sell shares to investors to raise cash and fund growth. By comparing a company's annual cash burn to its total market capitalisation, we can estimate roughly how many shares it would have to issue in order to run the company for another year (at the same burn rate).
Yunji's cash burn of CN¥309m is about 138% of its CN¥225m market capitalisation. That suggests the company may have some funding difficulties, and we'd be very wary of the stock.
Is Yunji's Cash Burn A Worry?
On this analysis of Yunji's cash burn, we think its cash runway was reassuring, while its cash burn relative to its market cap has us a bit worried. Considering all the measures mentioned in this report, we reckon that its cash burn is fairly risky, and if we held shares we'd be watching like a hawk for any deterioration. On another note, Yunji has 2 warning signs (and 1 which is significant) we think you should know about.
If you would prefer to check out another company with better fundamentals, then do not miss this free list of interesting companies, that have HIGH return on equity and low debt or this list of stocks which are all forecast to grow.
New: Manage All Your Stock Portfolios in One Place
We've created the ultimate portfolio companion for stock investors, and it's free.
• Connect an unlimited number of Portfolios and see your total in one currency
• Be alerted to new Warning Signs or Risks via email or mobile
• Track the Fair Value of your stocks
Have feedback on this article? Concerned about the content? Get in touch with us directly. Alternatively, email editorial-team (at) simplywallst.com.
This article by Simply Wall St is general in nature. We provide commentary based on historical data and analyst forecasts only using an unbiased methodology and our articles are not intended to be financial advice. It does not constitute a recommendation to buy or sell any stock, and does not take account of your objectives, or your financial situation. We aim to bring you long-term focused analysis driven by fundamental data. Note that our analysis may not factor in the latest price-sensitive company announcements or qualitative material. Simply Wall St has no position in any stocks mentioned.
About NasdaqCM:YJ
Yunji
Operates a social e-commerce platform in the People’s Republic of China.
Mediocre balance sheet and slightly overvalued.
Market Insights

Advertisement
Community Narratives
MINISO's fair value is projected at 26.69 with an anticipated PE ratio shift of 20x
Fair Value US$24.03|11.4% undervalued
BE
Community Contributor
Procter & Gamble: A Dividend Giant Facing Slowing Growth
Fair Value US$119.81|23.5% overvalued
AN
Community Contributor
Eli Lilly's Future Growth Driven by Tirzepatide and Favorable Market Conditions
Fair Value US$1.19k|14.0% undervalued
EA
Community Contributor