Advertisement
- United States
- /
- Specialty Stores
- /
- NasdaqGS:ORLY
Should You Reassess O'Reilly Stock After Its 36% Climb and Pricing Debate in 2025?

Simply Wall St
Reviewed by Bailey Pemberton
If you have O’Reilly Automotive in your portfolio or on your watchlist, there is a good chance you are weighing what is next for this auto parts powerhouse. With the stock’s price recently closing at $104.79, you might be wondering if there is more fuel left in the tank, or if the risk is building under the hood. Over the past year, the stock has powered ahead, up 36.5% in just 12 months and an impressive 242.8% over five years. Even with a slight dip of -2.6% over the past week, the year-to-date gain stands strong at 32.3%.
Much of this momentum reflects confidence that O’Reilly Automotive’s business model can keep delivering results, especially with ongoing trends favorable to the aftermarket auto sector. Still, the recent sideways trading suggests some investors may be reassessing growth expectations or simply taking a breather after such a long run. So, if you are reviewing valuation scores to justify a buy, here is a notable point: O’Reilly’s current score for undervaluation checks is 0 out of 6. That means it has not met a single criterion for appearing undervalued by traditional standards.
But before you get too focused on the numbers, let us explore the different methods analysts and investors use to value this kind of stock. Additionally, consider a broader way to think about valuation that goes beyond just the figures.
O'Reilly Automotive scores just 0/6 on our valuation checks. See what other red flags we found in the full valuation breakdown.
Approach 1: O'Reilly Automotive Discounted Cash Flow (DCF) Analysis
The Discounted Cash Flow (DCF) method estimates a company’s value by forecasting its future cash flows and then discounting them back to today. This approach gives investors an idea of what the business is intrinsically worth. For O’Reilly Automotive, the DCF model reviews projected Free Cash Flow (FCF) in dollars, reflecting what the business could generate for shareholders over time.
Currently, O’Reilly’s latest twelve-month Free Cash Flow stands at $1.87 billion. According to analyst consensus, the company’s FCF is expected to grow steadily, reaching about $3.18 billion by 2029. The first five years rely on analyst estimates, while later years are modeled using extrapolated growth rates.
The DCF model calculates an intrinsic value per share of $66.60, based on these discounted cash flow projections. With the stock recently trading at $104.79, this suggests the shares are trading about 57.4% above their intrinsic value according to this methodology. In other words, the discounted cash flow view indicates that O’Reilly Automotive appears to be overvalued at this time, and investors are paying a significant premium over what long-term cash flow projections would justify.
Result: OVERVALUED
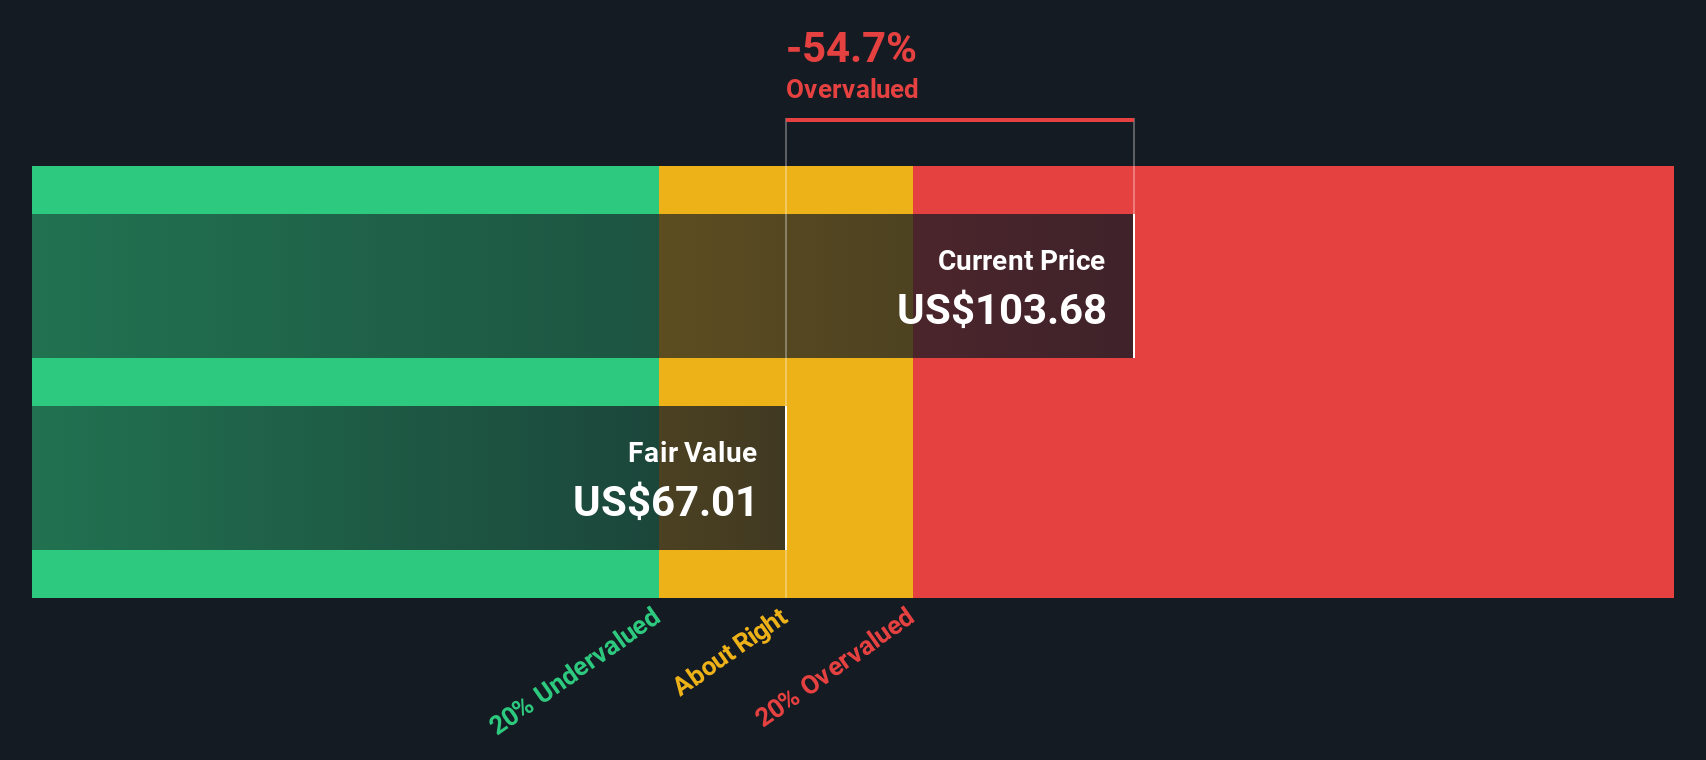
Our Discounted Cash Flow (DCF) analysis suggests O'Reilly Automotive may be overvalued by 57.4%. Find undervalued stocks or create your own screener to find better value opportunities.
Approach 2: O'Reilly Automotive Price vs Earnings
The Price-to-Earnings (PE) ratio is a fitting valuation tool for a company like O'Reilly Automotive, which has a solid track record of profitability. The PE ratio helps investors gauge how much they are paying for each dollar of earnings, making it particularly meaningful for established, profit-generating businesses in mature industries.
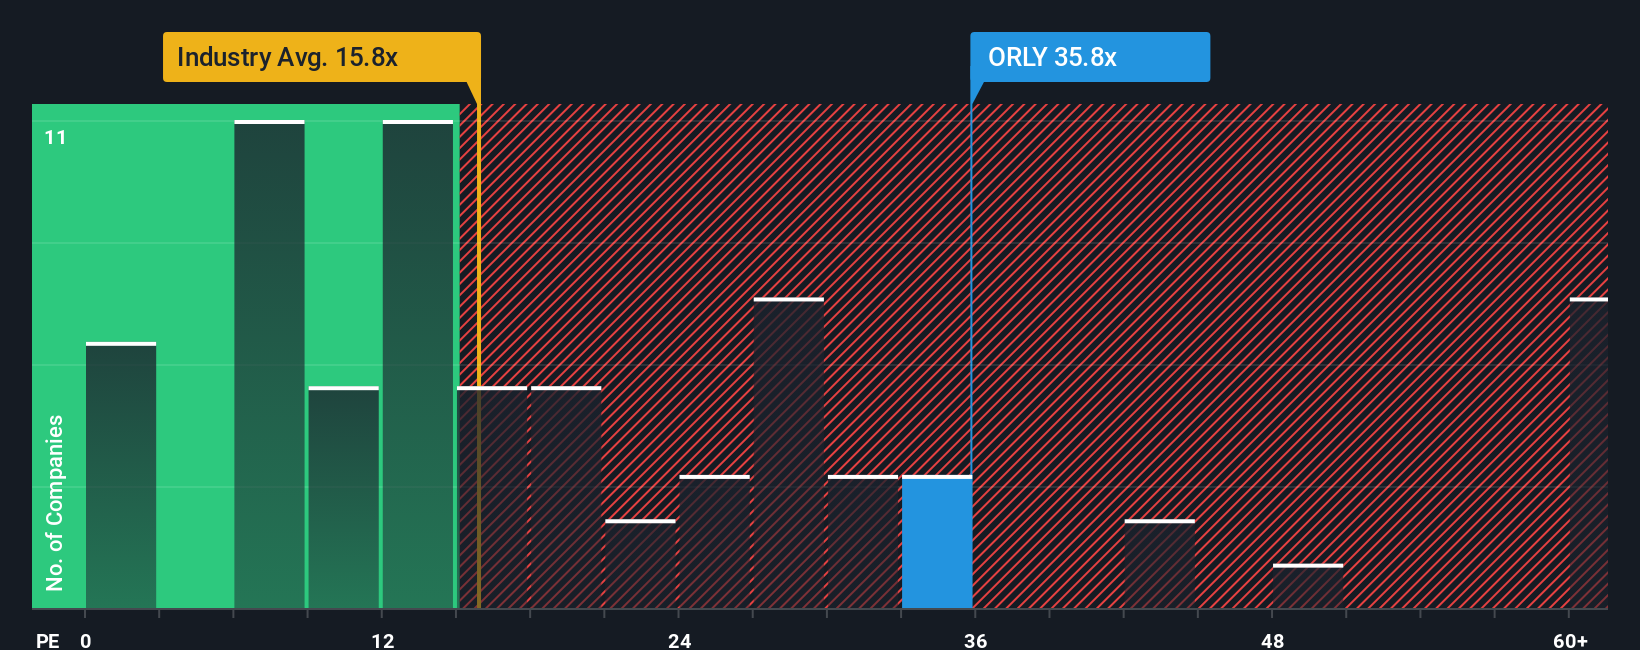
Growth expectations and perceived risk play a big role in shaping what is considered a “normal” or “fair” PE ratio. Higher expected growth and lower risk tend to justify a loftier PE multiple, while slower growth or higher risks typically pull it down. For O'Reilly Automotive, the current PE ratio stands at 36.7x. This is above the Specialty Retail industry average of 17.3x and slightly higher than the average PE of its closest peers, which is 35.4x.
This is where Simply Wall St's 'Fair Ratio' comes into play. The Fair Ratio sets a baseline multiple that factors in industry conditions, peer comparisons, and company-specific details such as profit margins, historical and forecast earnings growth, risk profile, and even market cap. In this case, O'Reilly’s Fair Ratio is 19.4x, notably lower than its current 36.7x valuation. By using the Fair Ratio, investors get a clearer picture of where the stock should be trading and account for more than just surface-level benchmarks.
Comparing the Fair Ratio to the stock’s actual PE, O'Reilly Automotive’s shares appear to be significantly overvalued using this approach.
Result: OVERVALUED
PE ratios tell one story, but what if the real opportunity lies elsewhere? Discover companies where insiders are betting big on explosive growth.
Upgrade Your Decision Making: Choose your O'Reilly Automotive Narrative
Earlier we mentioned that there is an even better way to understand valuation, so let us introduce you to Narratives. A Narrative is a simple yet powerful framework that lets you tell your own story about a company, connecting your personal assumptions on future revenue, profit margins, and growth rates to a corresponding financial forecast and fair value estimate.
Narratives link a company’s business story directly to the numbers, helping you picture exactly how your perspective translates into what the stock is worth right now. With Simply Wall St’s Community page, you can easily build, adapt, and follow Narratives. There, millions of investors share and update their views as news and earnings unfold.
This approach lets you see whether your Fair Value (based on your assumptions) is above or below the market Price, making it much clearer when a buy or sell decision lines up with the company’s outlook. Narratives update dynamically as new facts, news, or surprises come in so your investment view always stays fresh.
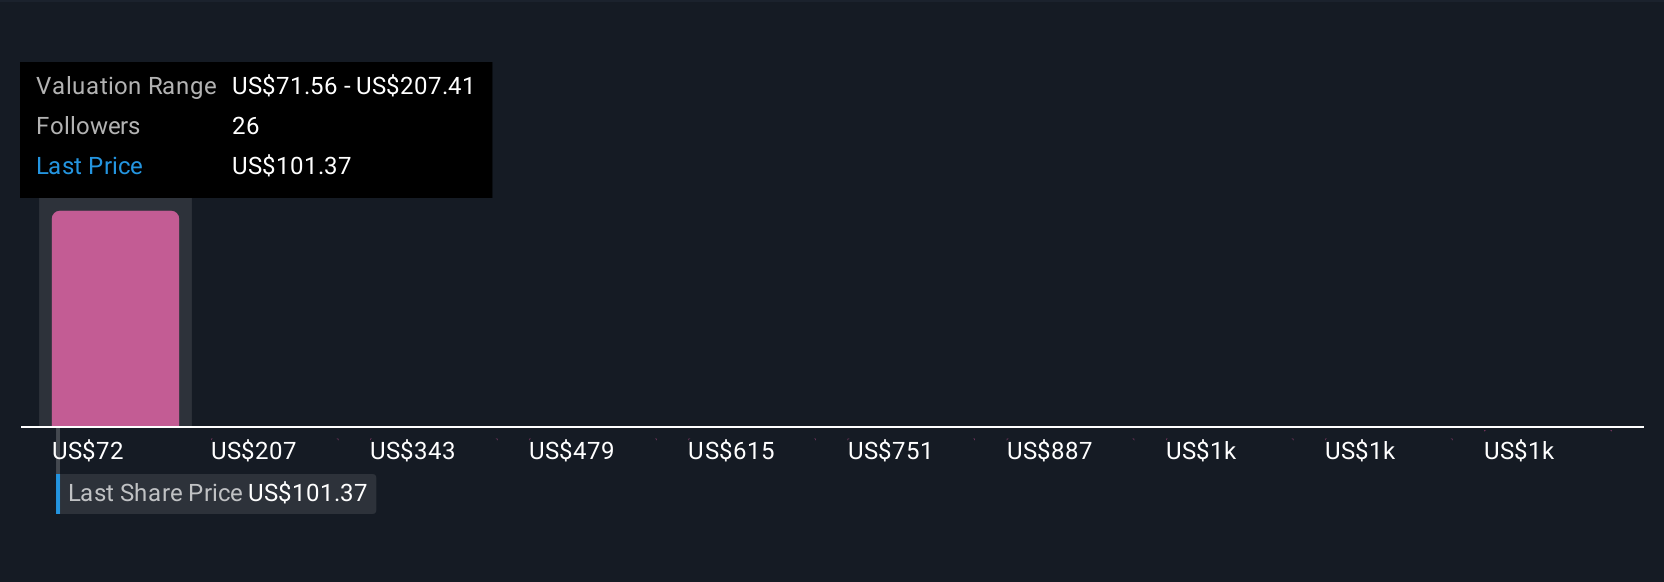
For example, some investors are optimistic about O’Reilly Automotive, anchored by projections of $20.5 billion in revenue and $3.0 billion in earnings by 2028 (implying a fair value of $120 per share). Others take a more cautious stance and see fair value closer to $62, based on less aggressive growth assumptions and ongoing industry risks.
Do you think there's more to the story for O'Reilly Automotive? Create your own Narrative to let the Community know!
This article by Simply Wall St is general in nature. We provide commentary based on historical data and analyst forecasts only using an unbiased methodology and our articles are not intended to be financial advice. It does not constitute a recommendation to buy or sell any stock, and does not take account of your objectives, or your financial situation. We aim to bring you long-term focused analysis driven by fundamental data. Note that our analysis may not factor in the latest price-sensitive company announcements or qualitative material. Simply Wall St has no position in any stocks mentioned.
New: AI Stock Screener & Alerts
Our new AI Stock Screener scans the market every day to uncover opportunities.
• Dividend Powerhouses (3%+ Yield)
• Undervalued Small Caps with Insider Buying
• High growth Tech and AI Companies
Or build your own from over 50 metrics.
Have feedback on this article? Concerned about the content? Get in touch with us directly. Alternatively, email editorial-team@simplywallst.com
About NasdaqGS:ORLY
O'Reilly Automotive
Operates as a retailer and supplier of automotive aftermarket parts, tools, supplies, equipment, and accessories in the United States, Puerto Rico, Mexico, and Canada.
Acceptable track record with limited growth.
Similar Companies
Market Insights

Advertisement
Community Narratives
The Next Phase of Energy Storage: How NeoVolta Is Tackling America’s Power Crunch
Fair Value US$7.50|35.1% undervalued
MA
Community Contributor
Why EnSilica is Worth Possibly 13x its Current Price
Fair Value UK£5.00|89.5% undervalued
DO
Community Contributor
M&A Activity, Industry Diversification & A Defense Contract Monopoly Will Push BWXT For Healthy Long-Term Growth
Fair Value US$220.00|15.2% undervalued
CL
Community Contributor
A case for Cassiar Gold Corp (TSXV: GLDC) to reach CAD$8-10 before 2030 (X30-37)
Fair Value CA$10.00|96.0% undervalued
AG
Community Contributor