Advertisement
- United States
- /
- General Merchandise and Department Stores
- /
- NasdaqGS:AMZN
Is Amazon Still Attractive After Its 17.7% Gain and Cloud Expansion in 2025?

Simply Wall St
Reviewed by Bailey Pemberton
If you’re wondering what to do with your Amazon.com shares right now, you’re not alone. Every investor, whether looking for long-term growth or trying to time the market, faces that pivotal moment when a stock starts to look a little more interesting than the rest. Over the past year, Amazon’s held its own, climbing 17.7%. If you zoom out a little further, there’s a lot more to unpack: a staggering 91.6% rise in the past three years, a 33.6% gain over five, and yet, more recently, a softer patch, with the stock down slightly, about -0.1% this past week, and around -2.9% for the past month. Market sentiment has been shifting as investor appetite for big tech meets fresh questions about risk and long-term growth. It’s a reminder that price moves aren’t always about company earnings. Sometimes it’s about what investors expect the future to hold and how current headlines shape that narrative.
So where does Amazon stand on valuation? If you’re using a scorecard approach, the company passes 4 out of 6 major undervaluation checks. This is not perfect but still impressive among its peers. However, simply checking those boxes only gives part of the story. Next, we’ll break down the traditional ways people measure value (everything from price-to-earnings to future growth potential), but stick around; there’s an even more insightful lens to view Amazon’s worth, and we’ll get to that by the end of this article.
Why Amazon.com is lagging behind its peers
Approach 1: Amazon.com Discounted Cash Flow (DCF) Analysis
A Discounted Cash Flow (DCF) model estimates a company’s value by projecting its future cash flows and then discounting those amounts back to their present-day value. This approach helps investors look past current noise and focus instead on long-term earning power.
For Amazon.com, the current Free Cash Flow (FCF) stands at $37.6 Billion. Analysts expect this figure to rise sharply, with projections indicating FCF could reach $135.0 Billion by the end of 2029. While analysts typically estimate up to five years of future cash flows, projections beyond this rely on Simply Wall St’s extrapolation. These estimates reflect confidence in Amazon’s ability to keep growing its cash-generating power over the next decade.
Using the 2 Stage Free Cash Flow to Equity model, Amazon.com’s intrinsic value is calculated at $272.21 per share. Based on today’s price, the DCF results suggest the stock is about 19.4% undervalued, representing a notable discount for a major tech company.
Result: UNDERVALUED
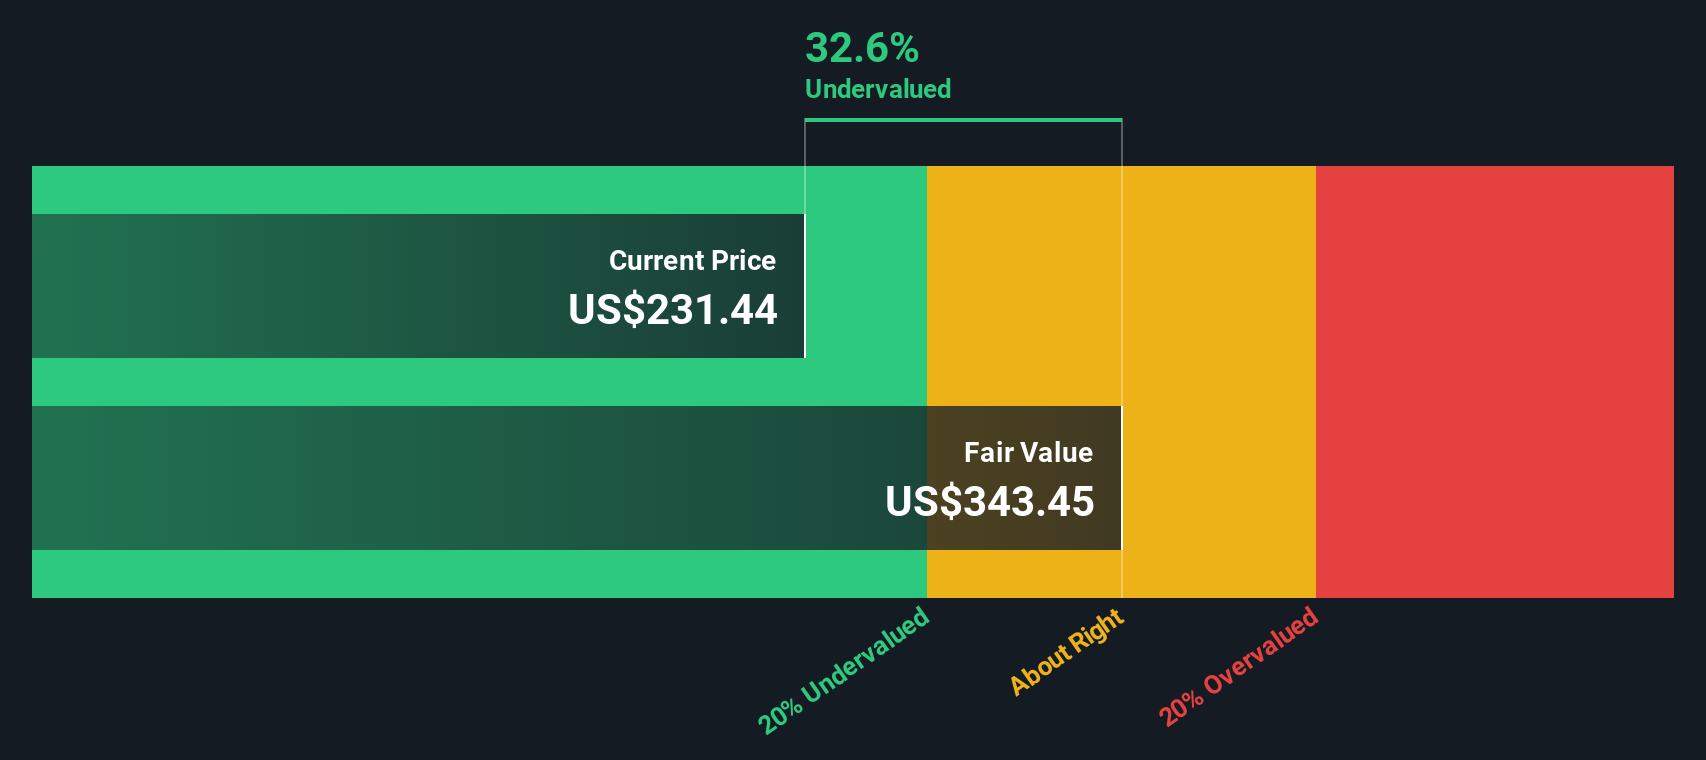
Our Discounted Cash Flow (DCF) analysis suggests Amazon.com is undervalued by 19.4%. Track this in your watchlist or portfolio, or discover more undervalued stocks.
Approach 2: Amazon.com Price vs Earnings
For profitable companies like Amazon.com, the price-to-earnings (PE) ratio is a widely relied-upon valuation multiple. This metric helps investors gauge what the market is willing to pay for each dollar of current earnings, allowing straightforward comparisons across businesses and industries. A higher PE ratio often signals higher growth expectations or lower risk. In contrast, a lower PE might hint at slower growth or greater uncertainty. Determining what counts as a “fair” PE depends on the company’s earnings trajectory, the outlook for its industry, and the risks involved.
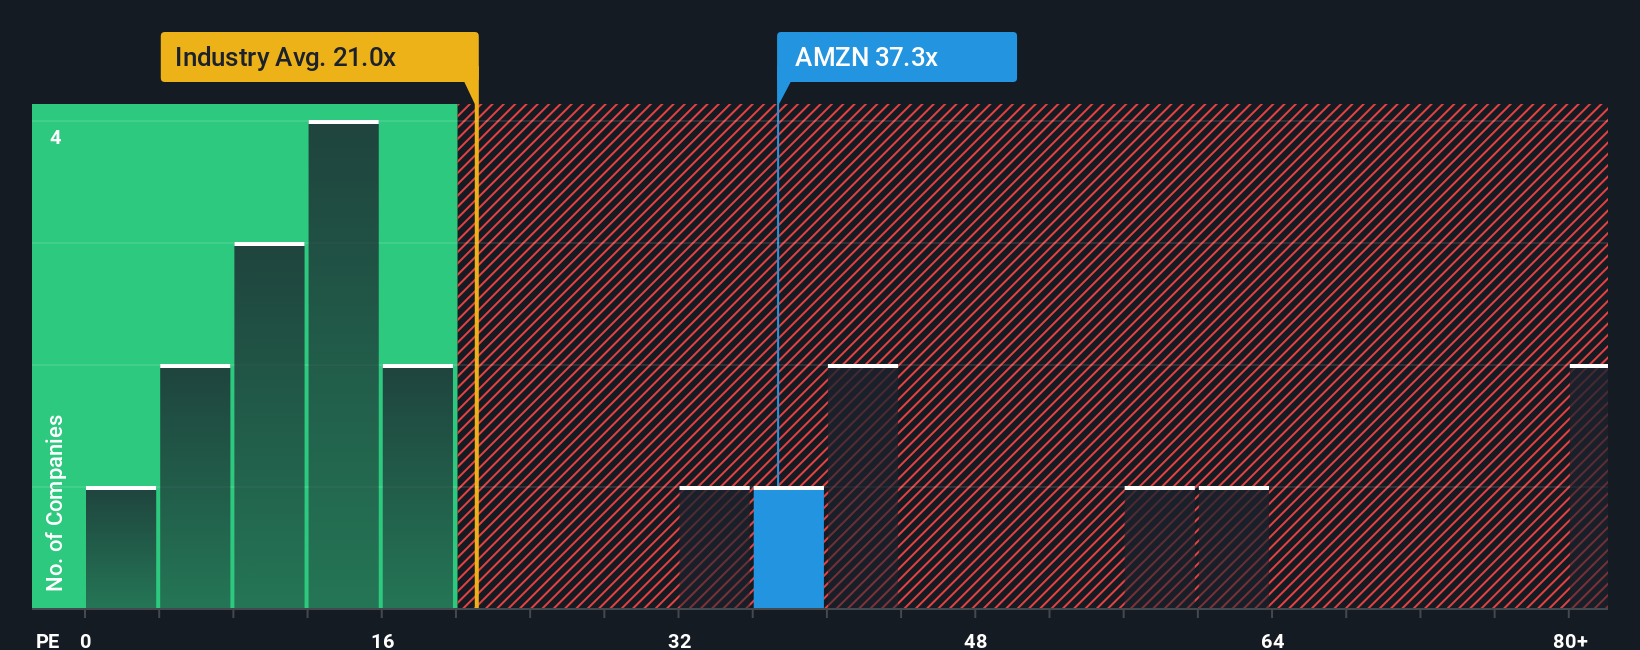
Amazon.com’s current PE ratio stands at 33.1x. When compared to the Multiline Retail industry average of 21.8x, Amazon is priced at a premium, reflecting strong earnings growth potential and unique competitive strengths. Looking at peers, the average PE is even higher at 44.8x, suggesting varied sentiment within the sector. However, industry and peer comparisons do not always capture everything that makes a company unique.
Simply Wall St’s “Fair Ratio” provides additional context. For Amazon, the Fair PE Ratio is calculated at 39.0x, which considers important factors like expected earnings growth, profit margins, risks, market cap, and nuances within its industry. This tailored approach offers a more complete perspective than simply comparing raw multiples. Amazon’s actual PE ratio of 33.1x is slightly below its Fair Ratio, suggesting that the stock is priced about right given its growth profile and risk.
Result: ABOUT RIGHT
PE ratios tell one story, but what if the real opportunity lies elsewhere? Discover companies where insiders are betting big on explosive growth.
Upgrade Your Decision Making: Choose your Amazon.com Narrative
Earlier we mentioned that there is an even better way to understand valuation, so let's introduce you to Narratives.
Narratives offer a smarter, more dynamic way for investors to make decisions by connecting the story behind a company, including its growth drivers, challenges, and outlook, directly to the financial forecasts and fair value estimates that matter most.
Instead of relying solely on traditional ratios or static models, Narratives let you explore different viewpoints. You can see assumptions about Amazon's future revenue, profit margins, and PE ratios, each shaped by the analyst or community member's perspective on the business.
On Simply Wall St’s Community page (used by millions of investors), Narratives are a convenient and accessible tool, helping you anchor your decisions to real forecasts and react quickly when the facts change.
This means that as news breaks or earnings are released, Narratives are updated automatically so fair values and investment cases adjust in real time. This provides a clearer signal for when to consider buying or selling Amazon shares.
For example, some investors see high AI-driven growth and price Amazon shares at $434, while others focus on slowing retail margins and set fair value closer to $151. This shows how your outlook and expectations can meaningfully shift your investment decision.
For Amazon.com, however, we'll make it really easy for you with previews of two leading Amazon.com Narratives:
Fair Value: $222.55
Currently trading about 1.37% below fair value
Revenue Growth Rate: 15.19%
- Amazon’s major profit and growth engines are AWS, Advertising, and the third-party seller ecosystem. These segments drive strong cash flows even when headline profits are suppressed by ongoing reinvestment.
- The long-term strategy focuses on optimizing core businesses, operational leverage, and expanding globally. This approach is supported by a best-in-class customer experience and the broad shift toward e-commerce and cloud adoption.
- Short-term profits and free cash flows remain modest as Amazon continues heavy investment. However, operating cash flow is growing rapidly, and the narrative expects robust growth in coming years.
Fair Value: $151.21
Currently trading about 45.12% above fair value
Revenue Growth Rate: 7.2%
- Amazon’s core retail business faces expansion limits and strong competition, especially in the U.S., while advertising and AWS remain key drivers of growth but at moderating rates.
- Profitability improvements and cost optimization are underway, but rising capital intensity and slower sales-to-capital ratios mean more investment will be required to sustain previous growth rates.
- Risks from regulatory pressures, international trade headwinds, and increasing competition from established retailers such as Walmart moving aggressively into e-commerce could constrain both growth and margins.
Do you think there's more to the story for Amazon.com? Create your own Narrative to let the Community know!
This article by Simply Wall St is general in nature. We provide commentary based on historical data and analyst forecasts only using an unbiased methodology and our articles are not intended to be financial advice. It does not constitute a recommendation to buy or sell any stock, and does not take account of your objectives, or your financial situation. We aim to bring you long-term focused analysis driven by fundamental data. Note that our analysis may not factor in the latest price-sensitive company announcements or qualitative material. Simply Wall St has no position in any stocks mentioned.
New: Manage All Your Stock Portfolios in One Place
We've created the ultimate portfolio companion for stock investors, and it's free.
• Connect an unlimited number of Portfolios and see your total in one currency
• Be alerted to new Warning Signs or Risks via email or mobile
• Track the Fair Value of your stocks
Have feedback on this article? Concerned about the content? Get in touch with us directly. Alternatively, email editorial-team@simplywallst.com
About NasdaqGS:AMZN
Amazon.com
Engages in the retail sale of consumer products, advertising, and subscriptions service through online and physical stores in North America and internationally.
Flawless balance sheet with solid track record.
Similar Companies
Market Insights

Advertisement
Community Narratives
The Next Phase of Energy Storage: How NeoVolta Is Tackling America’s Power Crunch
Fair Value US$7.50|35.1% undervalued
MA
Community Contributor
Why EnSilica is Worth Possibly 13x its Current Price
Fair Value UK£5.00|89.8% undervalued
DO
Community Contributor
M&A Activity, Industry Diversification & A Defense Contract Monopoly Will Push BWXT For Healthy Long-Term Growth
Fair Value US$220.00|15.2% undervalued
CL
Community Contributor
A case for Cassiar Gold Corp (TSXV: GLDC) to reach CAD$8-10 before 2030 (X30-37)
Fair Value CA$10.00|96.0% undervalued
AG
Community Contributor