- United States
- /
- Specialized REITs
- /
- NYSE:DLR
Digital Realty Trust (NYSE:DLR) investors are sitting on a loss of 24% if they invested a year ago


Passive investing in an index fund is a good way to ensure your own returns roughly match the overall market. Active investors aim to buy stocks that vastly outperform the market - but in the process, they risk under-performance. Investors in Digital Realty Trust, Inc. (NYSE:DLR) have tasted that bitter downside in the last year, as the share price dropped 28%. That contrasts poorly with the market decline of 13%. Longer term shareholders haven't suffered as badly, since the stock is down a comparatively less painful 17% in three years. Even worse, it's down 11% in about a month, which isn't fun at all. But this could be related to poor market conditions -- stocks are down 6.6% in the same time.
Since shareholders are down over the longer term, lets look at the underlying fundamentals over the that time and see if they've been consistent with returns.
View our latest analysis for Digital Realty Trust
To paraphrase Benjamin Graham: Over the short term the market is a voting machine, but over the long term it's a weighing machine. One flawed but reasonable way to assess how sentiment around a company has changed is to compare the earnings per share (EPS) with the share price.
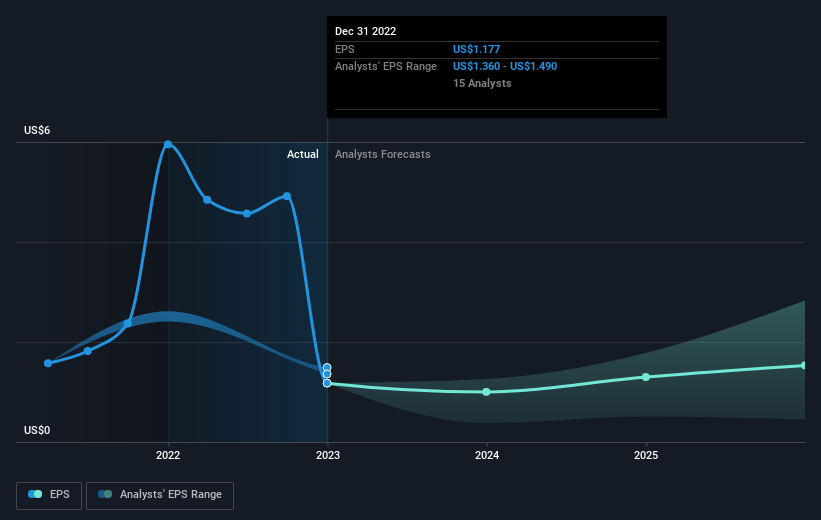
Unfortunately Digital Realty Trust reported an EPS drop of 80% for the last year. This fall in the EPS is significantly worse than the 28% the share price fall. So the market may not be too worried about the EPS figure, at the moment -- or it may have expected earnings to drop faster. Indeed, with a P/E ratio of 87.05 there is obviously some real optimism that earnings will bounce back.
The company's earnings per share (over time) is depicted in the image below (click to see the exact numbers).
We consider it positive that insiders have made significant purchases in the last year. Even so, future earnings will be far more important to whether current shareholders make money. It might be well worthwhile taking a look at our free report on Digital Realty Trust's earnings, revenue and cash flow.
What About Dividends?
When looking at investment returns, it is important to consider the difference between total shareholder return (TSR) and share price return. The TSR is a return calculation that accounts for the value of cash dividends (assuming that any dividend received was reinvested) and the calculated value of any discounted capital raisings and spin-offs. So for companies that pay a generous dividend, the TSR is often a lot higher than the share price return. In the case of Digital Realty Trust, it has a TSR of -24% for the last 1 year. That exceeds its share price return that we previously mentioned. The dividends paid by the company have thusly boosted the total shareholder return.
A Different Perspective
While the broader market lost about 13% in the twelve months, Digital Realty Trust shareholders did even worse, losing 24% (even including dividends). Having said that, it's inevitable that some stocks will be oversold in a falling market. The key is to keep your eyes on the fundamental developments. Longer term investors wouldn't be so upset, since they would have made 3%, each year, over five years. If the fundamental data continues to indicate long term sustainable growth, the current sell-off could be an opportunity worth considering. It's always interesting to track share price performance over the longer term. But to understand Digital Realty Trust better, we need to consider many other factors. Consider for instance, the ever-present spectre of investment risk. We've identified 3 warning signs with Digital Realty Trust (at least 1 which is a bit concerning) , and understanding them should be part of your investment process.
Digital Realty Trust is not the only stock insiders are buying. So take a peek at this free list of growing companies with insider buying.
Please note, the market returns quoted in this article reflect the market weighted average returns of stocks that currently trade on American exchanges.
If you're looking to trade Digital Realty Trust, open an account with the lowest-cost platform trusted by professionals, Interactive Brokers.
With clients in over 200 countries and territories, and access to 160 markets, IBKR lets you trade stocks, options, futures, forex, bonds and funds from a single integrated account.
Enjoy no hidden fees, no account minimums, and FX conversion rates as low as 0.03%, far better than what most brokers offer.
Sponsored ContentNew: Manage All Your Stock Portfolios in One Place
We've created the ultimate portfolio companion for stock investors, and it's free.
• Connect an unlimited number of Portfolios and see your total in one currency
• Be alerted to new Warning Signs or Risks via email or mobile
• Track the Fair Value of your stocks
Have feedback on this article? Concerned about the content? Get in touch with us directly. Alternatively, email editorial-team (at) simplywallst.com.
This article by Simply Wall St is general in nature. We provide commentary based on historical data and analyst forecasts only using an unbiased methodology and our articles are not intended to be financial advice. It does not constitute a recommendation to buy or sell any stock, and does not take account of your objectives, or your financial situation. We aim to bring you long-term focused analysis driven by fundamental data. Note that our analysis may not factor in the latest price-sensitive company announcements or qualitative material. Simply Wall St has no position in any stocks mentioned.
About NYSE:DLR
Digital Realty Trust
Digital Realty brings companies and data together by delivering the full spectrum of data center, colocation, and interconnection solutions.
Established dividend payer with reasonable growth potential.
Similar Companies
Market Insights

Community Narratives

