
Advertisement
- United States
- /
- Real Estate
- /
- NYSE:OPAD
Offerpad Solutions Inc.'s (NYSE:OPAD) Shares Leap 54% Yet They're Still Not Telling The Full Story
Offerpad Solutions Inc. (NYSE:OPAD) shareholders are no doubt pleased to see that the share price has bounced 54% in the last month, although it is still struggling to make up recently lost ground. Still, the 30-day jump doesn't change the fact that longer term shareholders have seen their stock decimated by the 58% share price drop in the last twelve months.
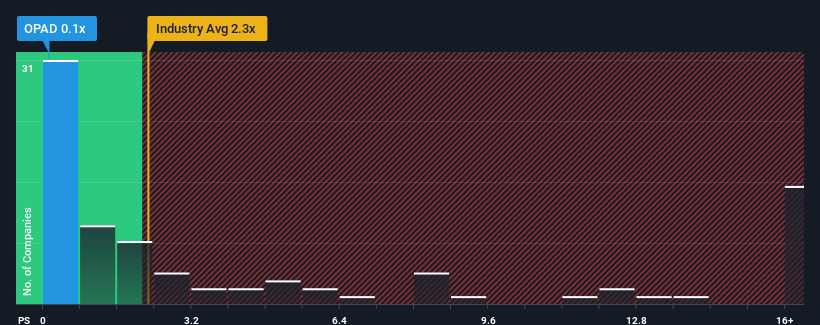
In spite of the firm bounce in price, Offerpad Solutions' price-to-sales (or "P/S") ratio of 0.1x might still make it look like a strong buy right now compared to the wider Real Estate industry in the United States, where around half of the companies have P/S ratios above 2.3x and even P/S above 9x are quite common. Although, it's not wise to just take the P/S at face value as there may be an explanation why it's so limited.
View our latest analysis for Offerpad Solutions
How Offerpad Solutions Has Been Performing
While the industry has experienced revenue growth lately, Offerpad Solutions' revenue has gone into reverse gear, which is not great. The P/S ratio is probably low because investors think this poor revenue performance isn't going to get any better. If this is the case, then existing shareholders will probably struggle to get excited about the future direction of the share price.
If you'd like to see what analysts are forecasting going forward, you should check out our free report on Offerpad Solutions.Do Revenue Forecasts Match The Low P/S Ratio?
There's an inherent assumption that a company should far underperform the industry for P/S ratios like Offerpad Solutions' to be considered reasonable.
Retrospectively, the last year delivered a frustrating 57% decrease to the company's top line. This means it has also seen a slide in revenue over the longer-term as revenue is down 5.7% in total over the last three years. Accordingly, shareholders would have felt downbeat about the medium-term rates of revenue growth.
Turning to the outlook, the next three years should generate growth of 16% per year as estimated by the five analysts watching the company. With the industry only predicted to deliver 11% per annum, the company is positioned for a stronger revenue result.
With this information, we find it odd that Offerpad Solutions is trading at a P/S lower than the industry. It looks like most investors are not convinced at all that the company can achieve future growth expectations.
The Key Takeaway
Shares in Offerpad Solutions have risen appreciably however, its P/S is still subdued. Typically, we'd caution against reading too much into price-to-sales ratios when settling on investment decisions, though it can reveal plenty about what other market participants think about the company.
To us, it seems Offerpad Solutions currently trades on a significantly depressed P/S given its forecasted revenue growth is higher than the rest of its industry. There could be some major risk factors that are placing downward pressure on the P/S ratio. At least price risks look to be very low, but investors seem to think future revenues could see a lot of volatility.
We don't want to rain on the parade too much, but we did also find 3 warning signs for Offerpad Solutions that you need to be mindful of.
Of course, profitable companies with a history of great earnings growth are generally safer bets. So you may wish to see this free collection of other companies that have reasonable P/E ratios and have grown earnings strongly.
New: AI Stock Screener & Alerts
Our new AI Stock Screener scans the market every day to uncover opportunities.
• Dividend Powerhouses (3%+ Yield)
• Undervalued Small Caps with Insider Buying
• High growth Tech and AI Companies
Or build your own from over 50 metrics.
Have feedback on this article? Concerned about the content? Get in touch with us directly. Alternatively, email editorial-team (at) simplywallst.com.
This article by Simply Wall St is general in nature. We provide commentary based on historical data and analyst forecasts only using an unbiased methodology and our articles are not intended to be financial advice. It does not constitute a recommendation to buy or sell any stock, and does not take account of your objectives, or your financial situation. We aim to bring you long-term focused analysis driven by fundamental data. Note that our analysis may not factor in the latest price-sensitive company announcements or qualitative material. Simply Wall St has no position in any stocks mentioned.
About NYSE:OPAD
Offerpad Solutions
Provides technology-enabled solutions for residential real estate market in the United States.
Excellent balance sheet with slight risk.
Similar Companies
Market Insights

Advertisement
Weekly Picks
RO


RockeTeller on Santacruz Silver Mining ·
Crazy Undervalued 42 Baggers Silver Play (Active & Running Mine)
Fair Value:CA$8696.4% undervalued
38 followersusers have followed this narrative
6 commentsusers have commented on this narrative
10 likesusers have liked this narrative
RO


Robbo on Fiducian Group ·
Fiducian: Compliance Clouds or Value Opportunity?
Fair Value:AU$126.1% undervalued
4 followersusers have followed this narrative
0 commentsusers have commented on this narrative
0 likesusers have liked this narrative
WO

woodworthfund on Willamette Valley Vineyards ·
Willamette Valley Vineyards (WVVI): Not-So-Great Value
Fair Value:US$244.5% overvalued
6 followersusers have followed this narrative
0 commentsusers have commented on this narrative
1 likeusers have liked this narrative
Recently Updated Narratives
FU

FundamentallySarcastic on Credit Corp Group ·
Moderation and Stabilisation: HOLD: Fair Price based on a 4-year Cycle is $12.08
Fair Value:AU$12.6411.4% overvalued
1 followerusers have followed this narrative
0 commentsusers have commented on this narrative
0 likesusers have liked this narrative
MA


MarkoVT on Alphabet ·
Positioned globally, partnered locally
Fair Value:US$390.1918.1% undervalued
2 followersusers have followed this narrative
0 commentsusers have commented on this narrative
0 likesusers have liked this narrative
JO


JohnJ on Worldline ·
When will fraudsters be investigated in depth. Fraud was ongoing in France too.
Fair Value:€0.5190.0% overvalued
1 followerusers have followed this narrative
0 commentsusers have commented on this narrative
0 likesusers have liked this narrative
Popular Narratives
TH


TheWallstreetKing on MicroVision ·
MicroVision will explode future revenue by 380.37% with a vision towards success
Fair Value:US$6098.5% undervalued
114 followersusers have followed this narrative
11 commentsusers have commented on this narrative
22 likesusers have liked this narrative
AN


AnalystConsensusTarget on NVIDIA ·
NVDA: Expanding AI Demand Will Drive Major Data Center Investments Through 2026
Fair Value:US$250.3928.3% undervalued
952 followersusers have followed this narrative
6 commentsusers have commented on this narrative
25 likesusers have liked this narrative
OS

oscargarcia on Alphabet ·
The company that turned a verb into a global necessity and basically runs the modern internet, digital ads, smartphones, maps, and AI.
Fair Value:US$3406.0% undervalued
148 followersusers have followed this narrative
6 commentsusers have commented on this narrative
18 likesusers have liked this narrative

