- United States
- /
- Real Estate
- /
- OTCPK:LUXH
Is LuxUrban Hotels Inc. (NASDAQ:LUXH) Trading At A 50% Discount?


Key Insights
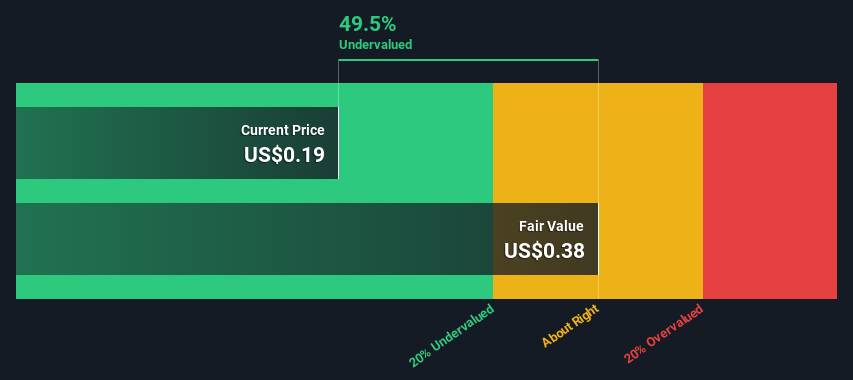
- Using the 2 Stage Free Cash Flow to Equity, LuxUrban Hotels fair value estimate is US$0.38
- LuxUrban Hotels' US$0.19 share price signals that it might be 50% undervalued
- Analyst price target for LUXH is US$5.33, which is 1,309% above our fair value estimate
Today we will run through one way of estimating the intrinsic value of LuxUrban Hotels Inc. (NASDAQ:LUXH) by taking the expected future cash flows and discounting them to today's value. This will be done using the Discounted Cash Flow (DCF) model. It may sound complicated, but actually it is quite simple!
We generally believe that a company's value is the present value of all of the cash it will generate in the future. However, a DCF is just one valuation metric among many, and it is not without flaws. If you still have some burning questions about this type of valuation, take a look at the Simply Wall St analysis model.
Check out our latest analysis for LuxUrban Hotels
The Calculation
We use what is known as a 2-stage model, which simply means we have two different periods of growth rates for the company's cash flows. Generally the first stage is higher growth, and the second stage is a lower growth phase. To start off with, we need to estimate the next ten years of cash flows. Where possible we use analyst estimates, but when these aren't available we extrapolate the previous free cash flow (FCF) from the last estimate or reported value. We assume companies with shrinking free cash flow will slow their rate of shrinkage, and that companies with growing free cash flow will see their growth rate slow, over this period. We do this to reflect that growth tends to slow more in the early years than it does in later years.
Generally we assume that a dollar today is more valuable than a dollar in the future, and so the sum of these future cash flows is then discounted to today's value:
10-year free cash flow (FCF) estimate
| 2025 | 2026 | 2027 | 2028 | 2029 | 2030 | 2031 | 2032 | 2033 | 2034 | |
| Levered FCF ($, Millions) | US$2.10m | US$2.73m | US$3.32m | US$3.84m | US$4.30m | US$4.68m | US$5.01m | US$5.29m | US$5.54m | US$5.76m |
| Growth Rate Estimate Source | Analyst x1 | Est @ 29.88% | Est @ 21.63% | Est @ 15.85% | Est @ 11.81% | Est @ 8.98% | Est @ 7.00% | Est @ 5.61% | Est @ 4.64% | Est @ 3.97% |
| Present Value ($, Millions) Discounted @ 12% | US$1.9 | US$2.2 | US$2.4 | US$2.5 | US$2.5 | US$2.4 | US$2.3 | US$2.2 | US$2.1 | US$1.9 |
("Est" = FCF growth rate estimated by Simply Wall St)
Present Value of 10-year Cash Flow (PVCF) = US$22m
The second stage is also known as Terminal Value, this is the business's cash flow after the first stage. The Gordon Growth formula is used to calculate Terminal Value at a future annual growth rate equal to the 5-year average of the 10-year government bond yield of 2.4%. We discount the terminal cash flows to today's value at a cost of equity of 12%.
Terminal Value (TV)= FCF2034 × (1 + g) ÷ (r – g) = US$5.8m× (1 + 2.4%) ÷ (12%– 2.4%) = US$64m
Present Value of Terminal Value (PVTV)= TV / (1 + r)10= US$64m÷ ( 1 + 12%)10= US$21m
The total value is the sum of cash flows for the next ten years plus the discounted terminal value, which results in the Total Equity Value, which in this case is US$44m. To get the intrinsic value per share, we divide this by the total number of shares outstanding. Compared to the current share price of US$0.2, the company appears quite good value at a 50% discount to where the stock price trades currently. Valuations are imprecise instruments though, rather like a telescope - move a few degrees and end up in a different galaxy. Do keep this in mind.
Important Assumptions
We would point out that the most important inputs to a discounted cash flow are the discount rate and of course the actual cash flows. If you don't agree with these result, have a go at the calculation yourself and play with the assumptions. The DCF also does not consider the possible cyclicality of an industry, or a company's future capital requirements, so it does not give a full picture of a company's potential performance. Given that we are looking at LuxUrban Hotels as potential shareholders, the cost of equity is used as the discount rate, rather than the cost of capital (or weighted average cost of capital, WACC) which accounts for debt. In this calculation we've used 12%, which is based on a levered beta of 2.000. Beta is a measure of a stock's volatility, compared to the market as a whole. We get our beta from the industry average beta of globally comparable companies, with an imposed limit between 0.8 and 2.0, which is a reasonable range for a stable business.
SWOT Analysis for LuxUrban Hotels
- Debt is well covered by earnings.
- Shareholders have been diluted in the past year.
- Forecast to reduce losses next year.
- Trading below our estimate of fair value by more than 20%.
- Significant insider buying over the past 3 months.
- Debt is not well covered by operating cash flow.
- Has less than 3 years of cash runway based on current free cash flow.
- Total liabilities exceed total assets, which raises the risk of financial distress.
- Not expected to become profitable over the next 3 years.
Looking Ahead:
Whilst important, the DCF calculation is only one of many factors that you need to assess for a company. DCF models are not the be-all and end-all of investment valuation. Preferably you'd apply different cases and assumptions and see how they would impact the company's valuation. If a company grows at a different rate, or if its cost of equity or risk free rate changes sharply, the output can look very different. What is the reason for the share price sitting below the intrinsic value? For LuxUrban Hotels, we've put together three pertinent aspects you should assess:
- Risks: We feel that you should assess the 5 warning signs for LuxUrban Hotels (3 make us uncomfortable!) we've flagged before making an investment in the company.
- Future Earnings: How does LUXH's growth rate compare to its peers and the wider market? Dig deeper into the analyst consensus number for the upcoming years by interacting with our free analyst growth expectation chart.
- Other Solid Businesses: Low debt, high returns on equity and good past performance are fundamental to a strong business. Why not explore our interactive list of stocks with solid business fundamentals to see if there are other companies you may not have considered!
PS. The Simply Wall St app conducts a discounted cash flow valuation for every stock on the NASDAQCM every day. If you want to find the calculation for other stocks just search here.
New: AI Stock Screener & Alerts
Our new AI Stock Screener scans the market every day to uncover opportunities.
• Dividend Powerhouses (3%+ Yield)
• Undervalued Small Caps with Insider Buying
• High growth Tech and AI Companies
Or build your own from over 50 metrics.
Have feedback on this article? Concerned about the content? Get in touch with us directly. Alternatively, email editorial-team (at) simplywallst.com.
This article by Simply Wall St is general in nature. We provide commentary based on historical data and analyst forecasts only using an unbiased methodology and our articles are not intended to be financial advice. It does not constitute a recommendation to buy or sell any stock, and does not take account of your objectives, or your financial situation. We aim to bring you long-term focused analysis driven by fundamental data. Note that our analysis may not factor in the latest price-sensitive company announcements or qualitative material. Simply Wall St has no position in any stocks mentioned.
Have feedback on this article? Concerned about the content? Get in touch with us directly. Alternatively, email editorial-team@simplywallst.com
About OTCPK:LUXH
LuxUrban Hotels
Engages in the leasing of entire existing hotels on a long-term basis and rent out hotel rooms in the properties it leases.
Medium-low and slightly overvalued.
Similar Companies
Market Insights

Community Narratives


