Advertisement
- United States
- /
- Pharma
- /
- NYSE:TEVA
Is Now the Right Moment for Teva Stock After Three Years of Strong Gains?

Simply Wall St
Reviewed by Bailey Pemberton
Thinking about what to do with Teva Pharmaceutical Industries stock right now? You are not alone. After a remarkable three-year run marked by a 136.5% gain, and a 14.4% rise over the last year, investors are taking notice and asking the same question: does more upside await, or is caution the wiser move?
Teva’s recent price moves provide plenty to ponder. Over the past week, shares have bounced 9.1%, building on a solid 5.6% advance in the last month. That kind of momentum often comes after encouraging market signals or shifts in how the company’s risk profile is being viewed. With ongoing industry changes and evolving attitudes toward generic drug makers, the market might be warming up to Teva’s outlook and operational progress.
Even after this run-up, Teva stands out with a valuation score of 6 out of 6, indicating that it appears undervalued across every key metric we track. That is not something you see every day, especially among established global players in the pharmaceutical space.
But what exactly goes into this valuation score, and what are the strengths and limitations of each approach? Here is a breakdown of the valuation checks that led to this perfect score. Stick around, because we will wrap up with a smarter perspective on how to think about valuation, one that could help you make better stock decisions not just for Teva, but for your whole portfolio.
Approach 1: Teva Pharmaceutical Industries Discounted Cash Flow (DCF) Analysis
The Discounted Cash Flow (DCF) model is a widely respected valuation approach that estimates a company’s true worth by projecting its future free cash flows and then “discounting” those projections back to today’s value. This method helps investors focus on the underlying cash generation capability of a business, not simply recent profits or market hype.
For Teva Pharmaceutical Industries, the latest Free Cash Flow (FCF) reported is $865.9 million. Analysts have offered estimates running out five years, with Simply Wall St extrapolating additional growth beyond that point. By 2029, annual FCF is projected to reach approximately $3.8 billion. This reflects strong anticipated operational improvements and greater cash generation. Over the next ten years, estimates indicate a continual upward trajectory, supported by sector expectations and company fundamentals.
Based on these cash flow projections and the DCF analysis, Teva’s intrinsic value is calculated at $58.33 per share. This suggests the stock is trading at a deep 65.7% discount to its estimated fair value. For investors, this indicates a substantial margin of safety and the potential for significant future gains if projections materialize as expected.
Result: UNDERVALUED
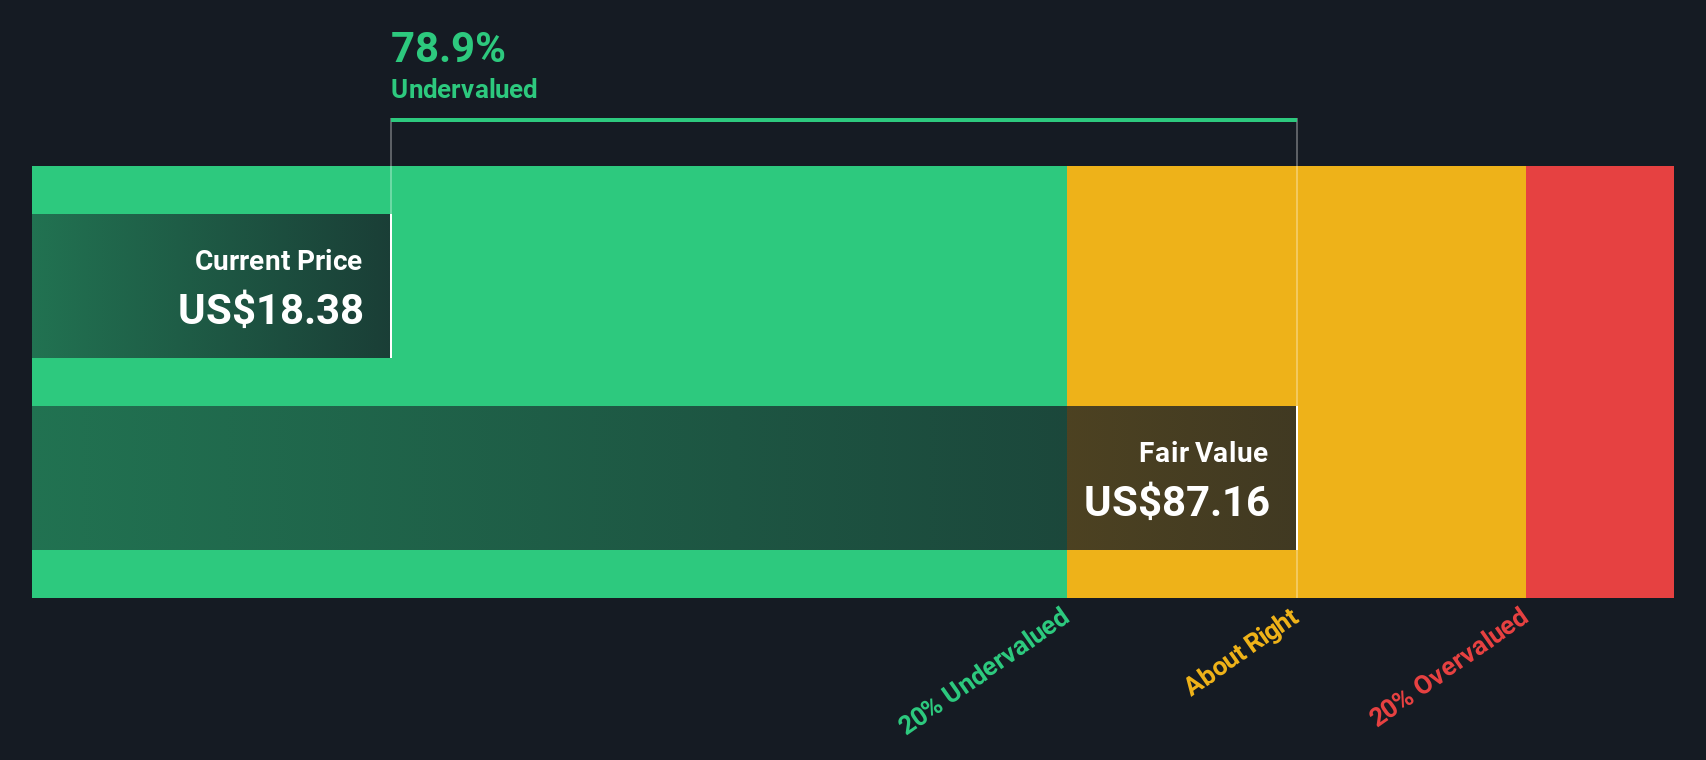
Our Discounted Cash Flow (DCF) analysis suggests Teva Pharmaceutical Industries is undervalued by 65.7%. Track this in your watchlist or portfolio, or discover more undervalued stocks.
Approach 2: Teva Pharmaceutical Industries Price vs Sales
The Price-to-Sales (P/S) ratio is a useful valuation metric for companies like Teva Pharmaceutical Industries, as it allows investors to compare the market’s valuation of the business to its actual sales figures. This approach is especially relevant for pharmaceutical companies where profits can fluctuate due to one-time charges or investment cycles. Revenues tend to provide a more stable, underlying measure of performance.
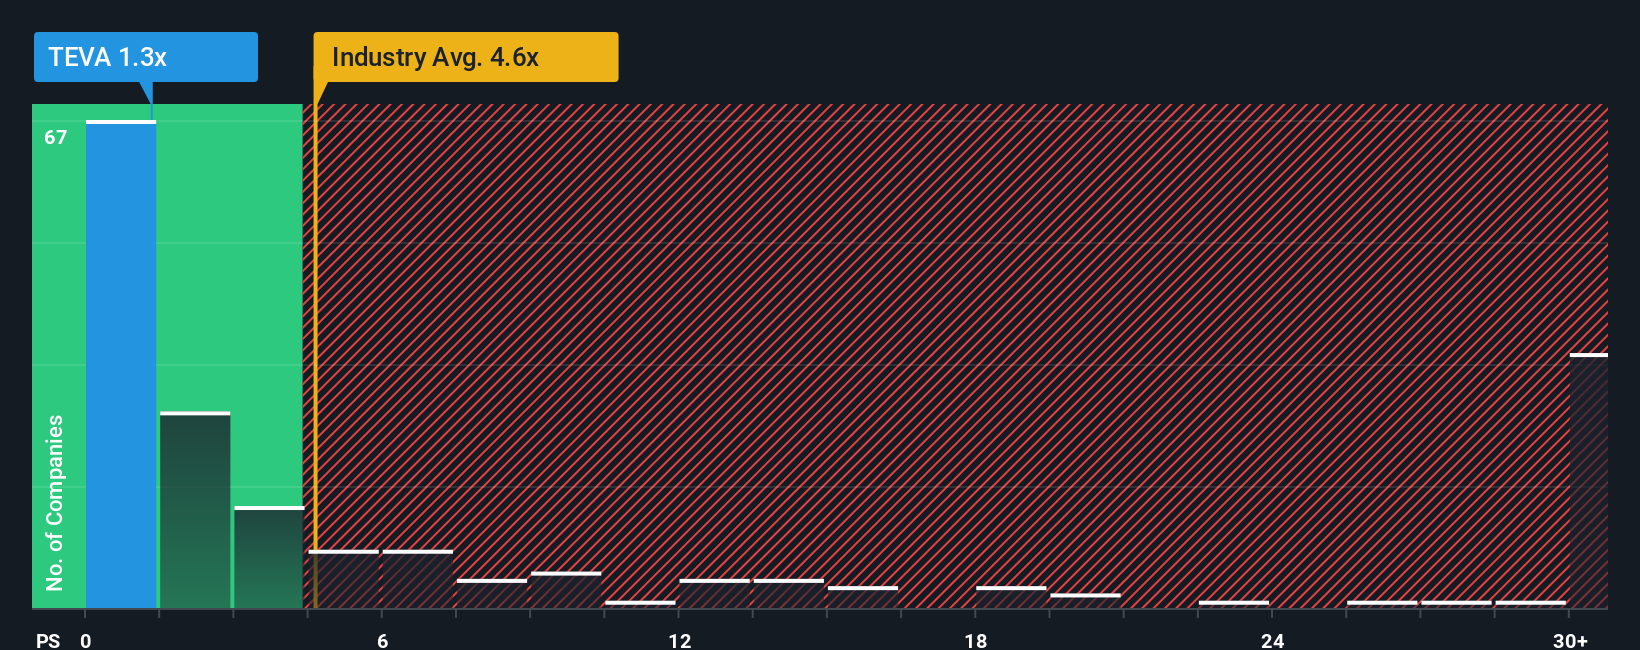
Growth expectations and perceived risks play a big role in determining what counts as a “normal” or “fair” P/S ratio. Fast-growing, lower-risk companies typically command higher multiples, while those facing uncertainty or slower growth trade at a discount. For Teva, the current P/S ratio stands at 1.38x, notably below both the pharmaceutical industry average of 4.85x and the peer group average of 2.99x. At first glance, this suggests Teva’s shares trade at a discount to both its sector and direct competitors.
However, looking only at industry averages or the performance of peers can be misleading. That is where Simply Wall St’s proprietary “Fair Ratio” helps investors dig deeper. This metric tailors a fair multiple for Teva by factoring in its expected growth, risks, profit margin, market cap, and industry context. For Teva, the Fair Ratio comes out to 4.20x, which is far above the company’s present multiple. This more holistic approach gives a stronger case for undervaluation, as it addresses company specifics that broad benchmarks miss.
Since Teva’s current P/S is well below its Fair Ratio, the stock appears to be trading at an attractive discount based on its revenue potential and outlook.
Result: UNDERVALUED
PS ratios tell one story, but what if the real opportunity lies elsewhere? Discover companies where insiders are betting big on explosive growth.
Upgrade Your Decision Making: Choose your Teva Pharmaceutical Industries Narrative
Earlier, we hinted at a smarter approach to understanding valuation, and here it is: Narratives. A Narrative is your personal story about a company, built from your expectations of how its business will evolve, which you translate into a financial forecast and a fair value estimate. This approach goes beyond the numbers, allowing you to connect what you believe about Teva Pharmaceutical Industries, including its potential for revenue growth, margin expansion, and industry challenges, to a clear valuation and decision point.
Millions of investors on Simply Wall St’s Community page use Narratives as an easy and interactive tool to map out their investment view, compare fair values to current prices, and make more informed buy or sell decisions. Narratives update automatically when new news or earnings are released, making sure your view stays relevant and timely.
For example, one investor’s Narrative for Teva might highlight growth from biosimilars and branded drug launches, supporting a price target of $29.00. Another might focus on debt risks and margin pressures, arriving at a more cautious $18.00 target. By exploring different Narratives, you can see how each perspective uses the same company data to create sharply different fair values. This can help you better understand your own stance and act confidently.
Do you think there's more to the story for Teva Pharmaceutical Industries? Create your own Narrative to let the Community know!

This article by Simply Wall St is general in nature. We provide commentary based on historical data and analyst forecasts only using an unbiased methodology and our articles are not intended to be financial advice. It does not constitute a recommendation to buy or sell any stock, and does not take account of your objectives, or your financial situation. We aim to bring you long-term focused analysis driven by fundamental data. Note that our analysis may not factor in the latest price-sensitive company announcements or qualitative material. Simply Wall St has no position in any stocks mentioned.
Valuation is complex, but we're here to simplify it.
Discover if Teva Pharmaceutical Industries might be undervalued or overvalued with our detailed analysis, featuring fair value estimates, potential risks, dividends, insider trades, and its financial condition.
Access Free AnalysisHave feedback on this article? Concerned about the content? Get in touch with us directly. Alternatively, email editorial-team@simplywallst.com
About NYSE:TEVA
Teva Pharmaceutical Industries
Develops, manufactures, markets, and distributes generic and other medicines, and biopharmaceutical products in the United States, Europe, Israel, and internationally.
Very undervalued with reasonable growth potential.
Similar Companies
Market Insights

Advertisement
Community Narratives
A formidable player in AI and enterprise computing.
Fair Value US$210.00|12.2% overvalued
CO
Community Contributor
IREN's Bold Moves in Sustainable Bitcoin Mining & AI Data Centers
Fair Value US$72.52|17.1% undervalued
BL
Community Contributor
Cooling the Champions: The Aussie Tech Behind F1's Victories
Fair Value AU$12.40|38.7% undervalued
TR
Community Contributor