Advertisement
- United States
- /
- Pharma
- /
- NYSE:JNJ
Is There Still Opportunity in J&J Shares After 32% Rally in 2025?

Simply Wall St
Reviewed by Bailey Pemberton
If you're sizing up what to do with your Johnson & Johnson shares or wondering if now might be the moment to get in, you're not alone. After all, J&J is one of those rare companies that sits at the intersection of stability and innovation, a combination that has kept it on investors’ watchlists for years. Recent numbers only add fuel to the discussion. Over the past year, the stock has climbed 21.9%, outpacing plenty of its peers. With a year-to-date return of 32.4%, and gaining another 7.1% in the last month alone, it is clear something is shifting in how the market views this blue chip name.
That uptick isn't just coming out of nowhere. Shifts in the broader healthcare sector, alongside renewed investor optimism about defensive stocks, have contributed to a wave of interest in Johnson & Johnson. Investors seem to be betting on both J&J’s ability to adapt and the value of its diversified business model, especially as markets keep searching for the next dependable play.
But here is where things get interesting. No matter how much market sentiment has improved, price is only half the story. Valuation matters, and according to the numbers, Johnson & Johnson scores a 4 on a scale where 6 means undervalued in every major check. So, it looks undervalued in most, but not all, ways that matter. Next, let’s dig into the different approaches analysts take to figure out whether a stock like J&J is truly worth its price tag, and explore why conventional methods might sometimes miss what savvy investors really need to know.
Approach 1: Johnson & Johnson Discounted Cash Flow (DCF) Analysis
A Discounted Cash Flow (DCF) model measures what a company is worth based on its ability to generate cash in the future. It estimates upcoming cash flows and discounts them back to today's dollars. This approach is widely used to determine a firm's intrinsic value, regardless of market sentiment.
For Johnson & Johnson, the latest trailing twelve months Free Cash Flow is $18.37 billion. Looking ahead, analysts estimate Free Cash Flow to steadily increase, projecting $35.5 billion by the end of 2029. While analysts typically forecast cash flows only a few years into the future, projections for J&J extend a full decade using both analyst data and additional extrapolation.
Running these numbers through the DCF model results in an intrinsic value estimate of $442.56 per share. With the stock currently trading at a discount of 56.9%, this suggests the shares are significantly undervalued compared with what the cash flow outlook would imply.
Result: UNDERVALUED
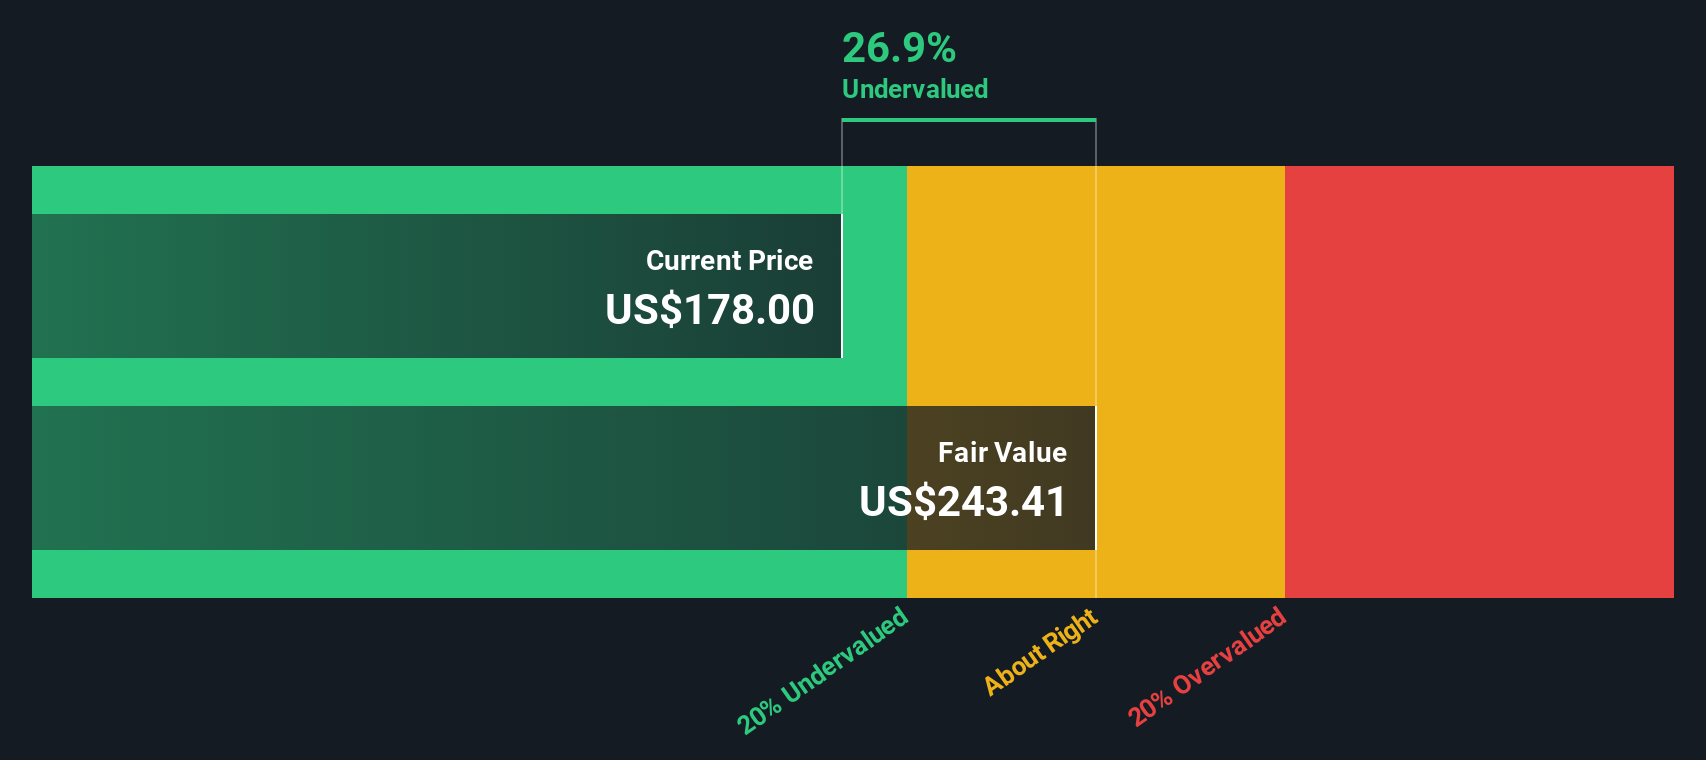
Our Discounted Cash Flow (DCF) analysis suggests Johnson & Johnson is undervalued by 56.9%. Track this in your watchlist or portfolio, or discover more undervalued stocks.
Approach 2: Johnson & Johnson Price vs Earnings (PE)
The Price-to-Earnings (PE) ratio is one of the most widely used valuation tools for profitable companies like Johnson & Johnson. It helps investors quickly gauge how much they are paying for each dollar of the company's earnings, making it especially useful when evaluating established businesses with consistent profits.
Typically, a "normal" or "fair" PE ratio depends on several factors, including a company’s growth prospects and risk profile. Companies expected to grow faster or with lower perceived risks can justify higher PE ratios, while those facing slower growth or elevated risks generally trade at lower multiples.
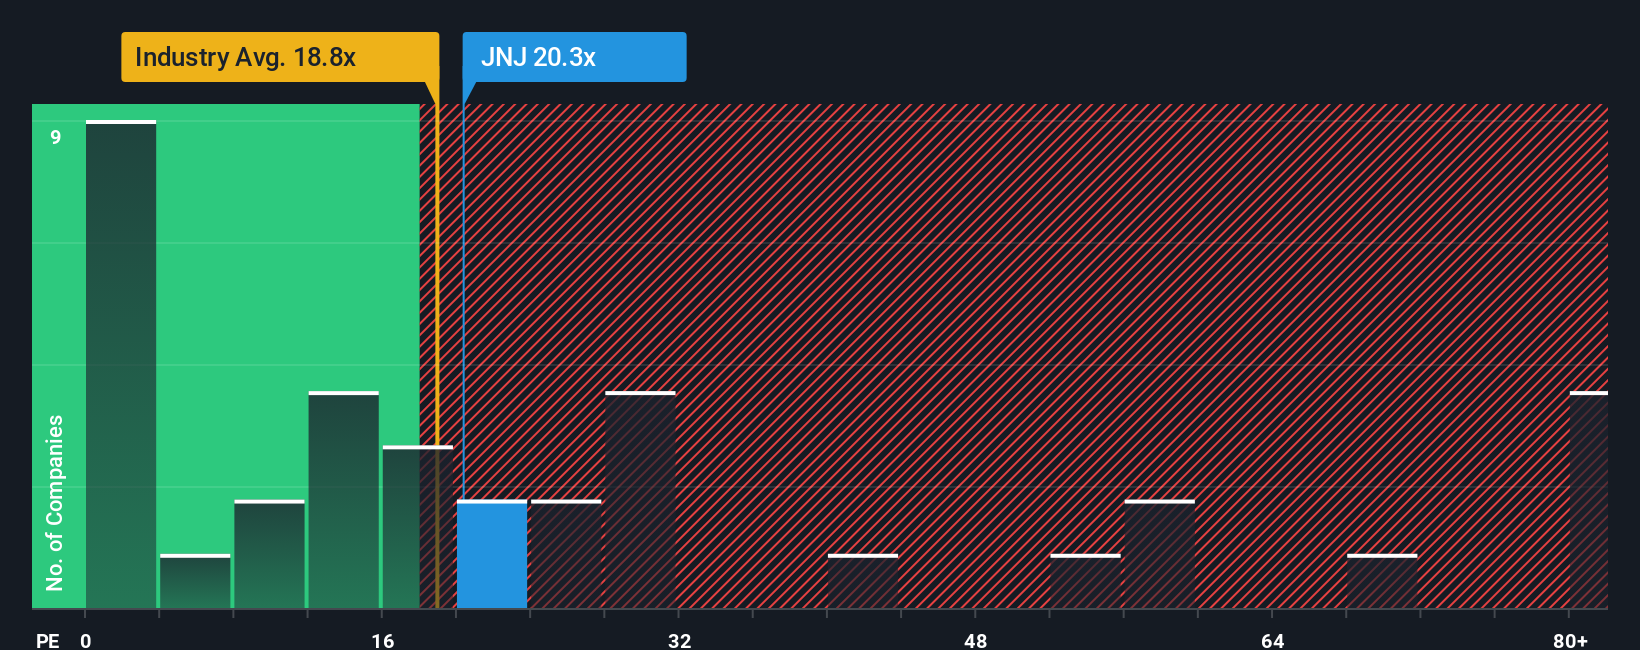
Johnson & Johnson currently trades on a PE ratio of 20.3x. That is slightly above the pharmaceutical industry average of 19.9x, but below the peer average of 24.5x. To provide more context, Simply Wall St calculates a proprietary “Fair Ratio” for each stock. For J&J, this stands at 24.0x. Unlike traditional benchmarks, the Fair Ratio takes into account not only industry peers but also the company’s growth outlook, profit margins, market capitalization, and business risks.
Comparing all these figures reveals that Johnson & Johnson’s actual PE ratio is noticeably below its Fair Ratio. This suggests that, after considering both the company-specific fundamentals and the broader landscape, J&J appears undervalued based on earnings.
Result: UNDERVALUED
PE ratios tell one story, but what if the real opportunity lies elsewhere? Discover companies where insiders are betting big on explosive growth.
Upgrade Your Decision Making: Choose your Johnson & Johnson Narrative
Earlier, we mentioned there is an even better way to make sense of valuation, so let’s introduce you to Narratives, a powerful and more personalized approach to investing that goes beyond the numbers. A Narrative is your story about a company: it connects your view of Johnson & Johnson’s future (expected revenue growth, profit margins, and fair value) to current events and forecasts, building a bridge between financial models and real-world context.
On Simply Wall St’s Community page, millions of investors use Narratives to frame their decisions. You can easily create one, see others’, and update yours whenever news or earnings shift the story. Narratives don’t just summarize your thinking; they provide a dynamic way to directly compare your fair value estimates to today’s share price, helping you decide if it is time to buy, hold, or sell.
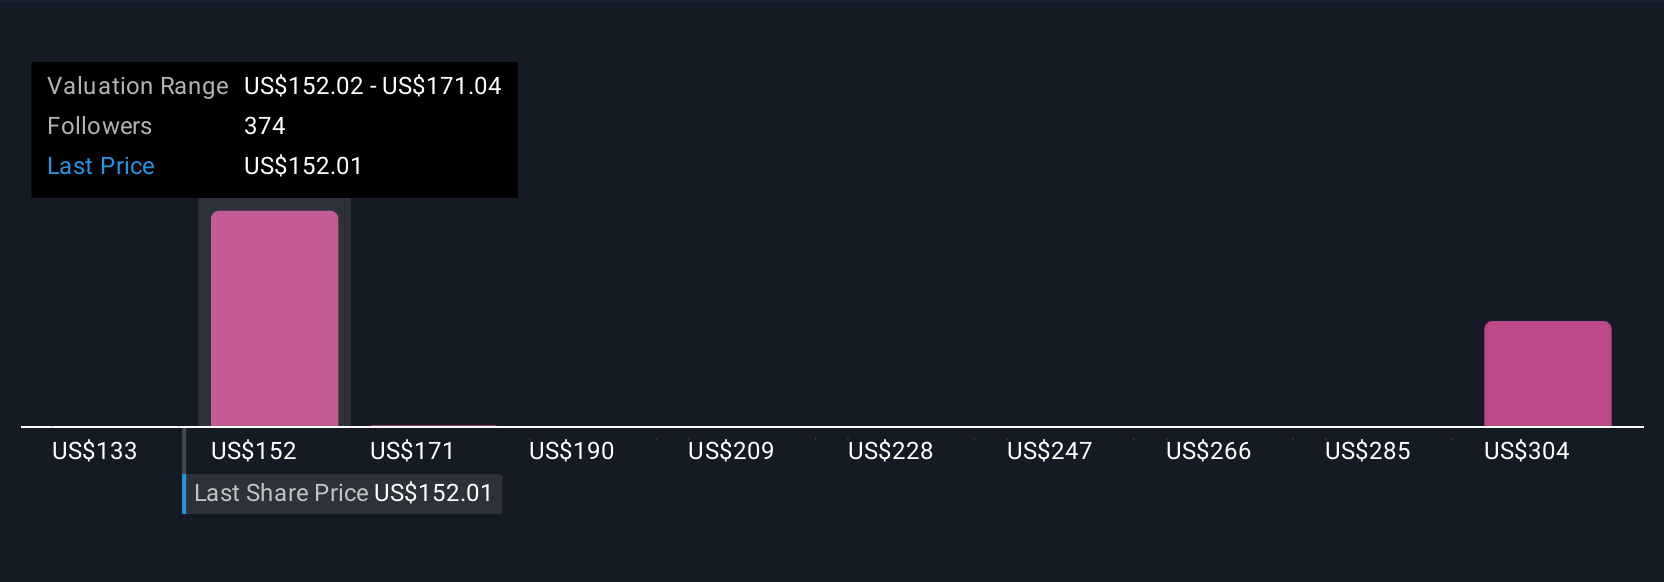
For example, one investor might see Johnson & Johnson’s strong drug pipeline and new MedTech focus supporting 7.5% annual revenue growth and a fair value around $174. Another might take a more cautious view, expecting growth below 5%, lower profit margins, and a fair value closer to $155. Narratives put those perspectives side by side, letting you see the differences and decide which story you believe.
Do you think there's more to the story for Johnson & Johnson? Create your own Narrative to let the Community know!
This article by Simply Wall St is general in nature. We provide commentary based on historical data and analyst forecasts only using an unbiased methodology and our articles are not intended to be financial advice. It does not constitute a recommendation to buy or sell any stock, and does not take account of your objectives, or your financial situation. We aim to bring you long-term focused analysis driven by fundamental data. Note that our analysis may not factor in the latest price-sensitive company announcements or qualitative material. Simply Wall St has no position in any stocks mentioned.
New: Manage All Your Stock Portfolios in One Place
We've created the ultimate portfolio companion for stock investors, and it's free.
• Connect an unlimited number of Portfolios and see your total in one currency
• Be alerted to new Warning Signs or Risks via email or mobile
• Track the Fair Value of your stocks
Have feedback on this article? Concerned about the content? Get in touch with us directly. Alternatively, email editorial-team@simplywallst.com
About NYSE:JNJ
Johnson & Johnson
Engages in the research and development, manufacture, and sale of various products in the healthcare field worldwide.
Outstanding track record established dividend payer.
Similar Companies
Market Insights

Advertisement
Community Narratives
A formidable player in AI and enterprise computing.
Fair Value US$210.00|10.9% overvalued
CO
Community Contributor
IREN's Bold Moves in Sustainable Bitcoin Mining & AI Data Centers
Fair Value US$72.52|12.0% undervalued
BL
Community Contributor
Cooling the Champions: The Aussie Tech Behind F1's Victories
Fair Value AU$12.40|38.7% undervalued
TR
Community Contributor