
Advertisement
- United States
- /
- Biotech
- /
- NasdaqGS:VOR
Vor Biopharma Inc.'s (NASDAQ:VOR) Intrinsic Value Is Potentially 55% Above Its Share Price
Key Insights
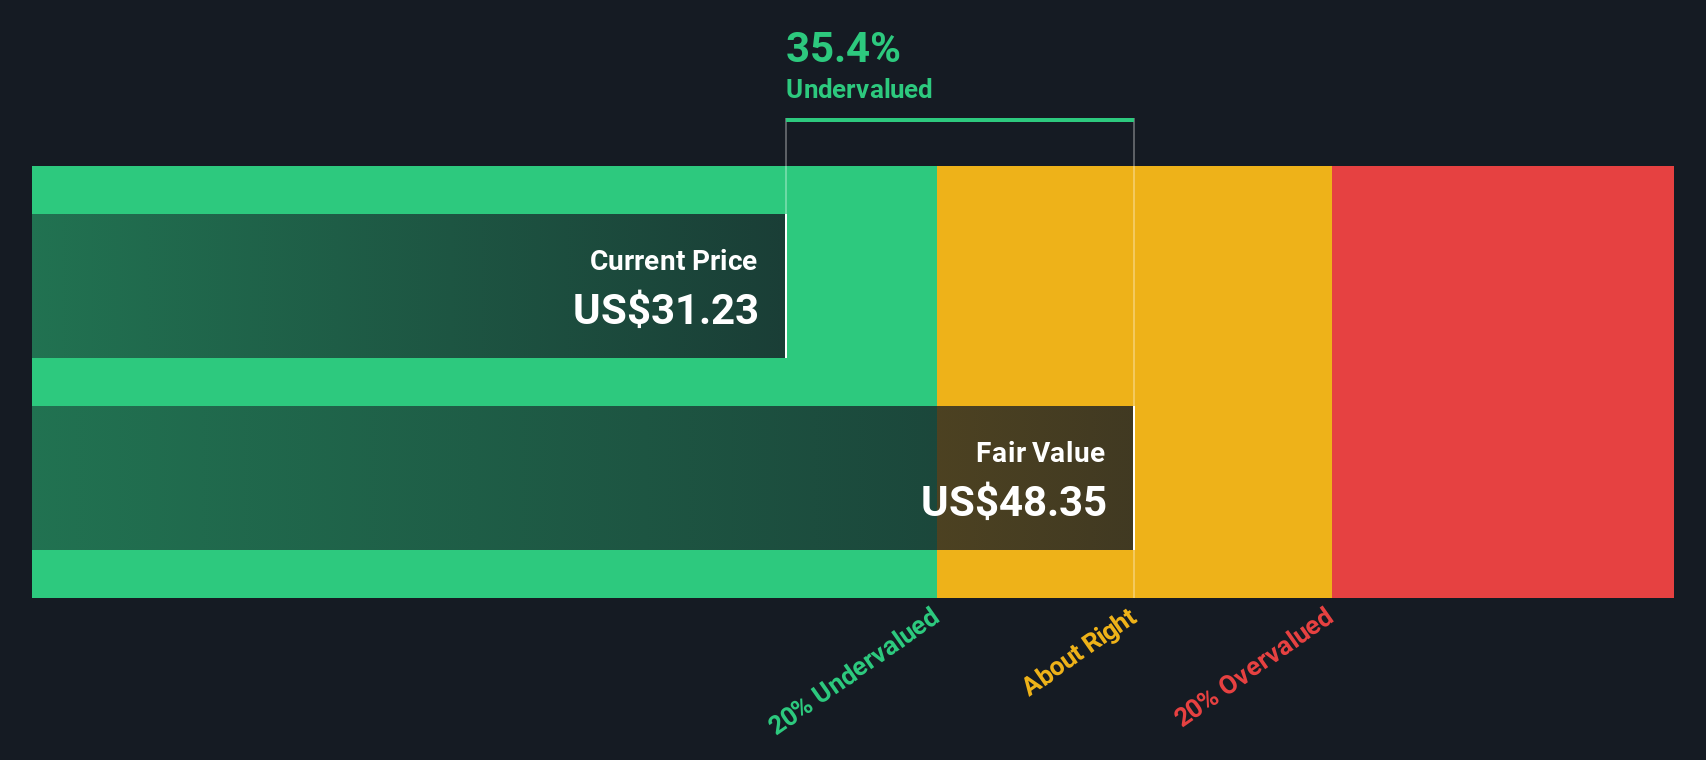
- The projected fair value for Vor Biopharma is US$48.35 based on 2 Stage Free Cash Flow to Equity
- Current share price of US$31.23 suggests Vor Biopharma is potentially 35% undervalued
- Analyst price target for VOR is US$35.75 which is 26% below our fair value estimate
Today we'll do a simple run through of a valuation method used to estimate the attractiveness of Vor Biopharma Inc. (NASDAQ:VOR) as an investment opportunity by taking the expected future cash flows and discounting them to their present value. We will use the Discounted Cash Flow (DCF) model on this occasion. Models like these may appear beyond the comprehension of a lay person, but they're fairly easy to follow.
We generally believe that a company's value is the present value of all of the cash it will generate in the future. However, a DCF is just one valuation metric among many, and it is not without flaws. Anyone interested in learning a bit more about intrinsic value should have a read of the Simply Wall St analysis model.
Crunching The Numbers
We use what is known as a 2-stage model, which simply means we have two different periods of growth rates for the company's cash flows. Generally the first stage is higher growth, and the second stage is a lower growth phase. To start off with, we need to estimate the next ten years of cash flows. Where possible we use analyst estimates, but when these aren't available we extrapolate the previous free cash flow (FCF) from the last estimate or reported value. We assume companies with shrinking free cash flow will slow their rate of shrinkage, and that companies with growing free cash flow will see their growth rate slow, over this period. We do this to reflect that growth tends to slow more in the early years than it does in later years.
A DCF is all about the idea that a dollar in the future is less valuable than a dollar today, and so the sum of these future cash flows is then discounted to today's value:
10-year free cash flow (FCF) forecast
| 2026 | 2027 | 2028 | 2029 | 2030 | 2031 | 2032 | 2033 | 2034 | 2035 | |
| Levered FCF ($, Millions) | -US$152.7m | -US$156.7m | -US$105.6m | US$13.9m | US$19.1m | US$24.2m | US$28.9m | US$33.2m | US$36.9m | US$40.1m |
| Growth Rate Estimate Source | Analyst x1 | Analyst x1 | Analyst x1 | Analyst x1 | Est @ 36.88% | Est @ 26.74% | Est @ 19.64% | Est @ 14.67% | Est @ 11.20% | Est @ 8.76% |
| Present Value ($, Millions) Discounted @ 6.8% | -US$143 | -US$137 | -US$86.7 | US$10.7 | US$13.7 | US$16.3 | US$18.3 | US$19.6 | US$20.4 | US$20.8 |
("Est" = FCF growth rate estimated by Simply Wall St)
Present Value of 10-year Cash Flow (PVCF) = -US$247m
The second stage is also known as Terminal Value, this is the business's cash flow after the first stage. The Gordon Growth formula is used to calculate Terminal Value at a future annual growth rate equal to the 5-year average of the 10-year government bond yield of 3.1%. We discount the terminal cash flows to today's value at a cost of equity of 6.8%.
Terminal Value (TV)= FCF2035 × (1 + g) ÷ (r – g) = US$40m× (1 + 3.1%) ÷ (6.8%– 3.1%) = US$1.1b
Present Value of Terminal Value (PVTV)= TV / (1 + r)10= US$1.1b÷ ( 1 + 6.8%)10= US$579m
The total value is the sum of cash flows for the next ten years plus the discounted terminal value, which results in the Total Equity Value, which in this case is US$331m. In the final step we divide the equity value by the number of shares outstanding. Compared to the current share price of US$31.2, the company appears quite undervalued at a 35% discount to where the stock price trades currently. The assumptions in any calculation have a big impact on the valuation, so it is better to view this as a rough estimate, not precise down to the last cent.
The Assumptions
The calculation above is very dependent on two assumptions. The first is the discount rate and the other is the cash flows. You don't have to agree with these inputs, I recommend redoing the calculations yourself and playing with them. The DCF also does not consider the possible cyclicality of an industry, or a company's future capital requirements, so it does not give a full picture of a company's potential performance. Given that we are looking at Vor Biopharma as potential shareholders, the cost of equity is used as the discount rate, rather than the cost of capital (or weighted average cost of capital, WACC) which accounts for debt. In this calculation we've used 6.8%, which is based on a levered beta of 0.803. Beta is a measure of a stock's volatility, compared to the market as a whole. We get our beta from the industry average beta of globally comparable companies, with an imposed limit between 0.8 and 2.0, which is a reasonable range for a stable business.
See our latest analysis for Vor Biopharma
SWOT Analysis for Vor Biopharma
Strength
- Currently debt free.
Weakness
- Shareholders have been diluted in the past year.
Opportunity
- Forecast to reduce losses next year.
- Trading below our estimate of fair value by more than 20%.
Threat
- Has less than 3 years of cash runway based on current free cash flow.
- Total liabilities exceed total assets, which raises the risk of financial distress.
- Not expected to become profitable over the next 3 years.
Moving On:
Whilst important, the DCF calculation ideally won't be the sole piece of analysis you scrutinize for a company. It's not possible to obtain a foolproof valuation with a DCF model. Preferably you'd apply different cases and assumptions and see how they would impact the company's valuation. For instance, if the terminal value growth rate is adjusted slightly, it can dramatically alter the overall result. What is the reason for the share price sitting below the intrinsic value? For Vor Biopharma, there are three further elements you should further research:
- Risks: Every company has them, and we've spotted 6 warning signs for Vor Biopharma (of which 3 are potentially serious!) you should know about.
- Future Earnings: How does VOR's growth rate compare to its peers and the wider market? Dig deeper into the analyst consensus number for the upcoming years by interacting with our free analyst growth expectation chart.
- Other High Quality Alternatives: Do you like a good all-rounder? Explore our interactive list of high quality stocks to get an idea of what else is out there you may be missing!
PS. The Simply Wall St app conducts a discounted cash flow valuation for every stock on the NASDAQGS every day. If you want to find the calculation for other stocks just search here.
New: Manage All Your Stock Portfolios in One Place
We've created the ultimate portfolio companion for stock investors, and it's free.
• Connect an unlimited number of Portfolios and see your total in one currency
• Be alerted to new Warning Signs or Risks via email or mobile
• Track the Fair Value of your stocks
Have feedback on this article? Concerned about the content? Get in touch with us directly. Alternatively, email editorial-team (at) simplywallst.com.
This article by Simply Wall St is general in nature. We provide commentary based on historical data and analyst forecasts only using an unbiased methodology and our articles are not intended to be financial advice. It does not constitute a recommendation to buy or sell any stock, and does not take account of your objectives, or your financial situation. We aim to bring you long-term focused analysis driven by fundamental data. Note that our analysis may not factor in the latest price-sensitive company announcements or qualitative material. Simply Wall St has no position in any stocks mentioned.
About NasdaqGS:VOR
Vor Biopharma
Operates as a clinical-stage cell and genome engineering company.
Medium-low risk with mediocre balance sheet.
Market Insights

Advertisement
Community Narratives
A formidable player in AI and enterprise computing.
Fair Value US$210.00|12.2% overvalued
CO
Community Contributor
IREN's Bold Moves in Sustainable Bitcoin Mining & AI Data Centers
Fair Value US$72.52|17.1% undervalued
BL
Community Contributor
Cooling the Champions: The Aussie Tech Behind F1's Victories
Fair Value AU$12.40|38.7% undervalued
TR
Community Contributor