- United States
- /
- Biotech
- /
- NasdaqCM:TGTX
TG Therapeutics (NASDAQ:TGTX) Has A Somewhat Strained Balance Sheet


Warren Buffett famously said, 'Volatility is far from synonymous with risk.' When we think about how risky a company is, we always like to look at its use of debt, since debt overload can lead to ruin. Importantly, TG Therapeutics, Inc. (NASDAQ:TGTX) does carry debt. But should shareholders be worried about its use of debt?
What Risk Does Debt Bring?
Debt is a tool to help businesses grow, but if a business is incapable of paying off its lenders, then it exists at their mercy. Part and parcel of capitalism is the process of 'creative destruction' where failed businesses are mercilessly liquidated by their bankers. However, a more frequent (but still costly) occurrence is where a company must issue shares at bargain-basement prices, permanently diluting shareholders, just to shore up its balance sheet. Of course, plenty of companies use debt to fund growth, without any negative consequences. The first step when considering a company's debt levels is to consider its cash and debt together.
Check out our latest analysis for TG Therapeutics
What Is TG Therapeutics's Debt?
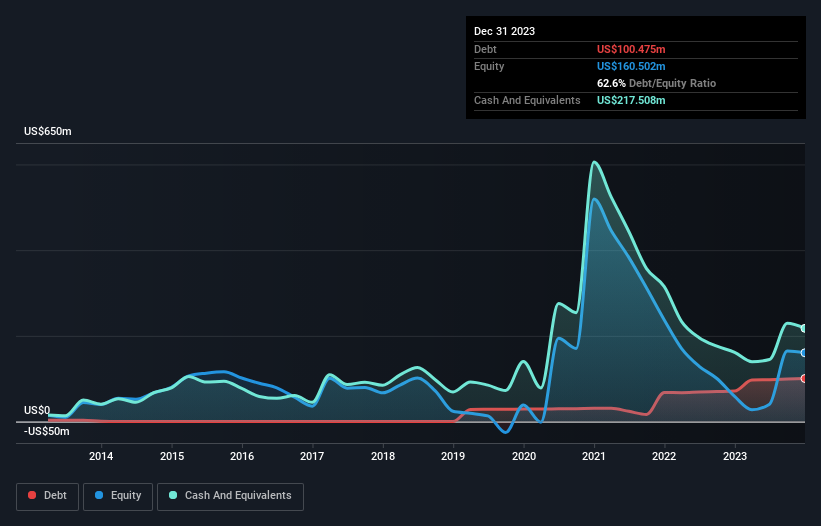
As you can see below, at the end of December 2023, TG Therapeutics had US$100.5m of debt, up from US$71.4m a year ago. Click the image for more detail. But on the other hand it also has US$217.5m in cash, leading to a US$117.0m net cash position.
How Strong Is TG Therapeutics' Balance Sheet?
We can see from the most recent balance sheet that TG Therapeutics had liabilities of US$53.7m falling due within a year, and liabilities of US$115.4m due beyond that. Offsetting these obligations, it had cash of US$217.5m as well as receivables valued at US$51.1m due within 12 months. So it actually has US$99.5m more liquid assets than total liabilities.
This surplus suggests that TG Therapeutics has a conservative balance sheet, and could probably eliminate its debt without much difficulty. Simply put, the fact that TG Therapeutics has more cash than debt is arguably a good indication that it can manage its debt safely.
Notably, TG Therapeutics made a loss at the EBIT level, last year, but improved that to positive EBIT of US$21m in the last twelve months. There's no doubt that we learn most about debt from the balance sheet. But it is future earnings, more than anything, that will determine TG Therapeutics's ability to maintain a healthy balance sheet going forward. So if you're focused on the future you can check out this free report showing analyst profit forecasts.
Finally, a company can only pay off debt with cold hard cash, not accounting profits. While TG Therapeutics has net cash on its balance sheet, it's still worth taking a look at its ability to convert earnings before interest and tax (EBIT) to free cash flow, to help us understand how quickly it is building (or eroding) that cash balance. Over the last year, TG Therapeutics saw substantial negative free cash flow, in total. While investors are no doubt expecting a reversal of that situation in due course, it clearly does mean its use of debt is more risky.
Summing Up
While we empathize with investors who find debt concerning, you should keep in mind that TG Therapeutics has net cash of US$117.0m, as well as more liquid assets than liabilities. So although we see some areas for improvement, we're not too worried about TG Therapeutics's balance sheet. The balance sheet is clearly the area to focus on when you are analysing debt. However, not all investment risk resides within the balance sheet - far from it. To that end, you should be aware of the 3 warning signs we've spotted with TG Therapeutics .
When all is said and done, sometimes its easier to focus on companies that don't even need debt. Readers can access a list of growth stocks with zero net debt 100% free, right now.
Valuation is complex, but we're here to simplify it.
Discover if TG Therapeutics might be undervalued or overvalued with our detailed analysis, featuring fair value estimates, potential risks, dividends, insider trades, and its financial condition.
Access Free AnalysisHave feedback on this article? Concerned about the content? Get in touch with us directly. Alternatively, email editorial-team (at) simplywallst.com.
This article by Simply Wall St is general in nature. We provide commentary based on historical data and analyst forecasts only using an unbiased methodology and our articles are not intended to be financial advice. It does not constitute a recommendation to buy or sell any stock, and does not take account of your objectives, or your financial situation. We aim to bring you long-term focused analysis driven by fundamental data. Note that our analysis may not factor in the latest price-sensitive company announcements or qualitative material. Simply Wall St has no position in any stocks mentioned.
About NasdaqCM:TGTX
TG Therapeutics
A commercial stage biopharmaceutical company, focuses on the acquisition, development, and commercialization of novel treatments for B-cell mediated diseases in the United States and internationally.
Exceptional growth potential with excellent balance sheet.
