Advertisement
- United States
- /
- Biotech
- /
- NasdaqGS:SRRK
Scholar Rock Surges 405% in 2024 Is There Still Upside After Recent Pipeline Progress?

Simply Wall St
Reviewed by Bailey Pemberton
If you are holding Scholar Rock Holding shares or thinking about jumping in, this is the kind of moment that's both exciting and nerve-wracking. After all, the stock’s performance has been nothing short of eye-catching. A 405.0% gain over the past year and a 384.1% gain in the last three years puts it on the radar of even casual market watchers. Price moves like these don’t happen without some major shifts in outlook, whether it’s new developments in Scholar Rock's pipeline, shifts in the competitive landscape, or changes in investor optimism about the biotech sector overall.
Of course, the path hasn’t been perfectly smooth. Just in the last week, the stock dipped by 3.3%, and year-to-date, it’s still trailing at -15.1%. But the longer-term growth is hard to ignore, and that’s got many investors wondering if the recent volatility is just short-term noise or if it signals a deeper change in risk perception for Scholar Rock Holding. Meanwhile, a value score of 4 out of 6 shows the company passes most of the key checks for being undervalued. This is impressive for a stock with such recent momentum and longer-term gains over 150% in five years.
So, is Scholar Rock Holding too good to be true, or is there still more room to run? The next section breaks down the numbers behind the valuation, and, if you stick with us, we’ll also share a smarter way to size up the stock that goes beyond the usual scorecard.
Approach 1: Scholar Rock Holding Discounted Cash Flow (DCF) Analysis
A Discounted Cash Flow (DCF) model projects a company’s future cash flows and then discounts them back to today’s value to estimate what the business is really worth. This method helps investors look past market noise and focus on more fundamental value.
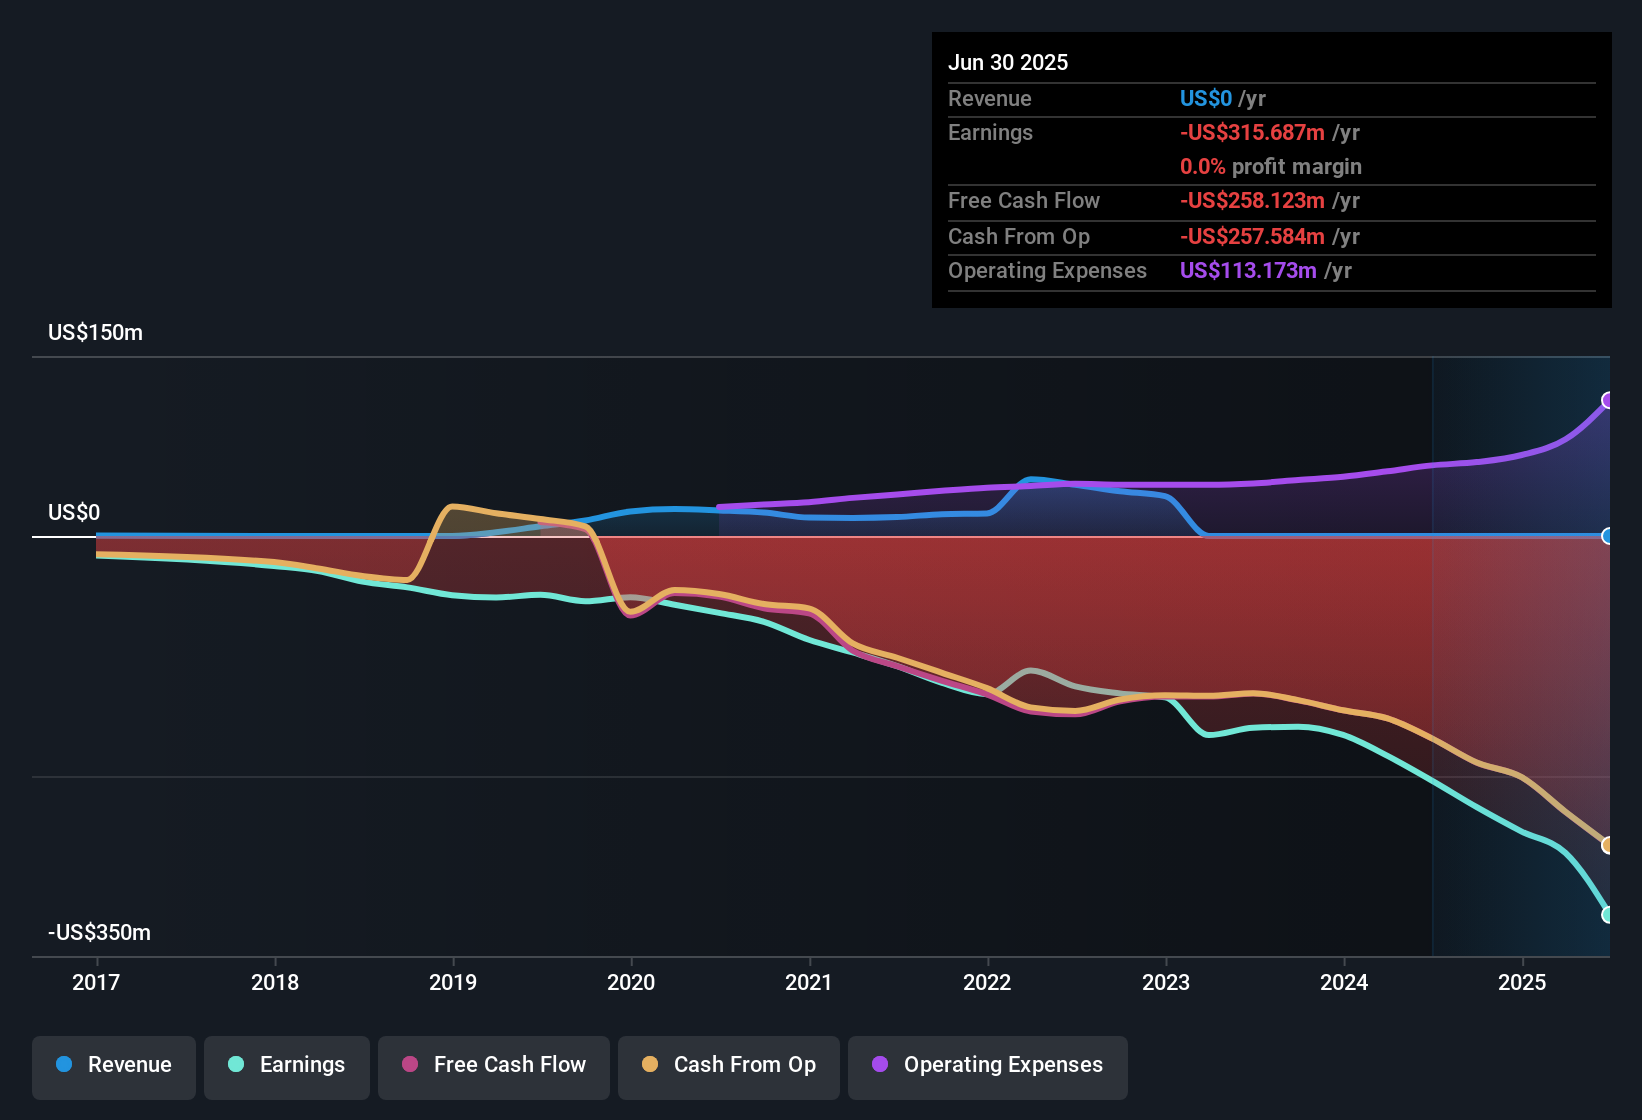
Scholar Rock Holding’s latest reported Free Cash Flow (FCF) was -$258.1 Million. Analysts forecast a turnaround with FCF expected to reach $339 Million by 2029. For the next ten years, projections, based on both analyst estimates and extended modeling, anticipate a steady climb, with FCF surpassing $1.2 Billion by 2035. All projections are in US dollars.
By discounting each year’s future cash flows using the two-stage method, the model estimates an intrinsic value of $218.25 per share. This is a striking 82.8% above the current stock price, suggesting that Scholar Rock Holding is significantly undervalued in the market right now.
The conclusion? Based on cash flow fundamentals, the market may be missing the real potential here.
Result: UNDERVALUED
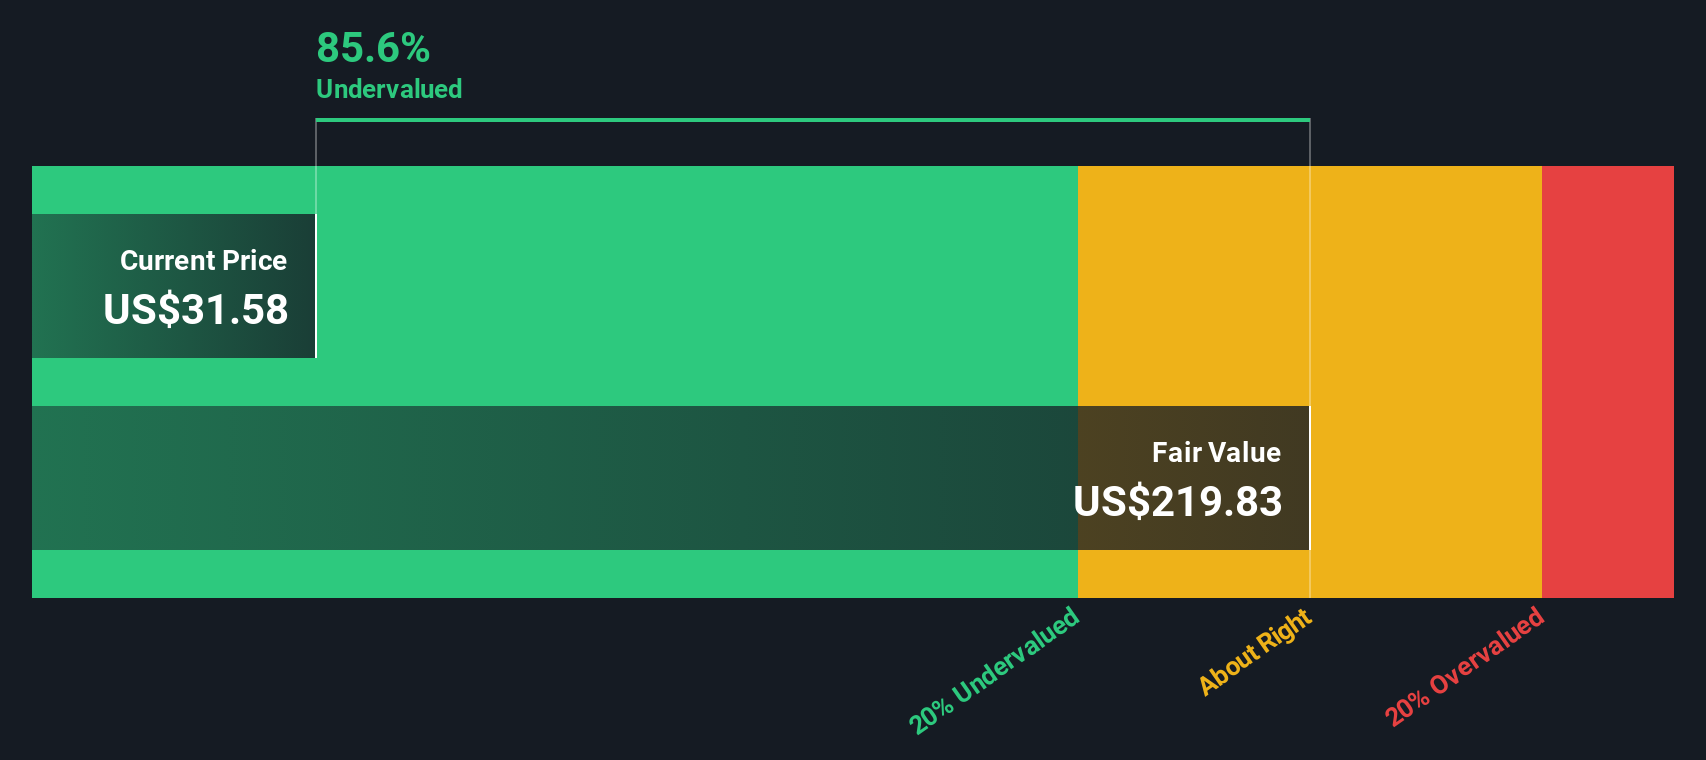
Our Discounted Cash Flow (DCF) analysis suggests Scholar Rock Holding is undervalued by 82.8%. Track this in your watchlist or portfolio, or discover more undervalued stocks.
Approach 2: Scholar Rock Holding Price vs Book
For companies in the biotech space where profits may be volatile or negative, the Price-to-Book (PB) ratio is often used as an anchor for valuation. The PB ratio measures how much investors are paying for a company’s net assets, making it especially relevant for firms whose current earnings do not tell the whole story. Growth prospects and risk are important factors in this context since fast-growing or lower-risk companies can justify higher PB ratios, while slower-growing or riskier ones tend to warrant lower multiples.
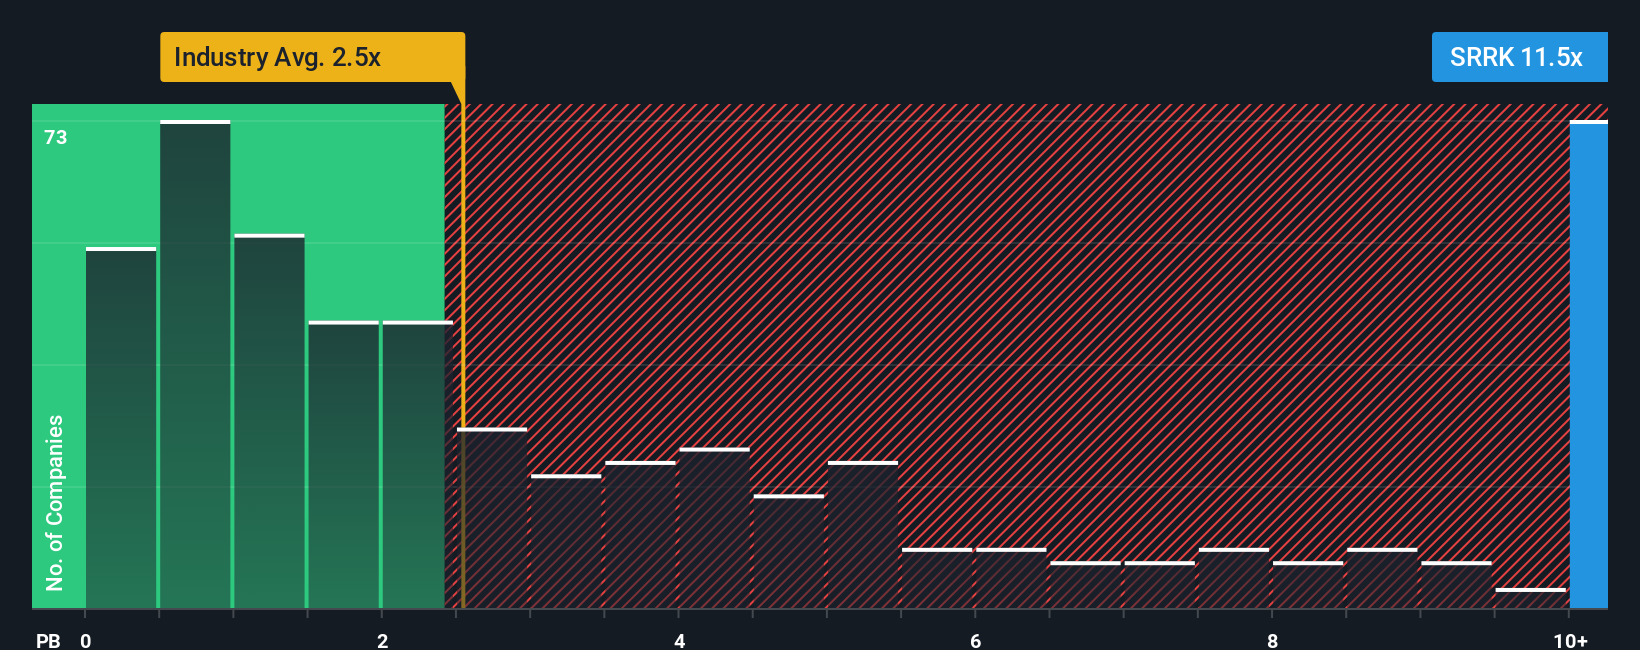
Currently, Scholar Rock Holding trades at a PB ratio of 15.44x. This is noticeably higher than the industry average of 2.47x for biotechs and above the peer average of 20.65x. On the surface, this may give the impression that Scholar Rock Holding is trading at a premium compared to its sector.
To dig deeper, Simply Wall St’s proprietary “Fair Ratio” looks beyond standard benchmarks by factoring in earnings growth, risk profile, profit margins, industry dynamics, and company size. By taking these core elements into account, the Fair Ratio provides a more tailored and accurate sense of what a reasonable PB multiple should be for Scholar Rock Holding, rather than simply comparing it to broad averages that may miss company-specific nuances.
In this case, Scholar Rock Holding’s actual PB ratio is significantly higher than both the industry standard and its calculated Fair Ratio, suggesting the stock could be overvalued on this metric alone.
Result: OVERVALUED
PB ratios tell one story, but what if the real opportunity lies elsewhere? Discover companies where insiders are betting big on explosive growth.
Upgrade Your Decision Making: Choose your Scholar Rock Holding Narrative
Earlier, we mentioned that there is an even better way to understand valuation. Let's introduce you to Narratives. Narratives let you connect your own story and perspective about a company to the numbers that drive its future, such as your assumptions for fair value, future revenue, earnings, and profit margins. In simple terms, a Narrative links Scholar Rock Holding’s potential and trajectory to a financial forecast, allowing you to see how your view translates into an objective estimate of fair value.
This approach is available right inside the Community page on Simply Wall St, making it easy and accessible for millions of investors to set or refine their Narrative. Narratives empower you to make informed decisions by clearly comparing your Fair Value to the current stock price. Since Narratives update automatically as new information comes in, your outlook always reflects the latest news or results.
For example, with Scholar Rock Holding, some investors may see the company’s fair value as much higher than the current price if they forecast aggressive pipeline successes. Others might set a more conservative fair value if they see greater execution risks. Narratives help you back up your conviction with logic and dynamic data.
Do you think there's more to the story for Scholar Rock Holding? Create your own Narrative to let the Community know!
This article by Simply Wall St is general in nature. We provide commentary based on historical data and analyst forecasts only using an unbiased methodology and our articles are not intended to be financial advice. It does not constitute a recommendation to buy or sell any stock, and does not take account of your objectives, or your financial situation. We aim to bring you long-term focused analysis driven by fundamental data. Note that our analysis may not factor in the latest price-sensitive company announcements or qualitative material. Simply Wall St has no position in any stocks mentioned.
New: Manage All Your Stock Portfolios in One Place
We've created the ultimate portfolio companion for stock investors, and it's free.
• Connect an unlimited number of Portfolios and see your total in one currency
• Be alerted to new Warning Signs or Risks via email or mobile
• Track the Fair Value of your stocks
Have feedback on this article? Concerned about the content? Get in touch with us directly. Alternatively, email editorial-team@simplywallst.com
About NasdaqGS:SRRK
Scholar Rock Holding
A biopharmaceutical company, focuses on the discovery, development, and delivery of medicines for the treatment of serious diseases in which signaling by protein growth factors plays a fundamental role.
Adequate balance sheet and fair value.
Market Insights

Advertisement
Community Narratives
A formidable player in AI and enterprise computing.
Fair Value US$210.00|12.2% overvalued
CO
Community Contributor
IREN's Bold Moves in Sustainable Bitcoin Mining & AI Data Centers
Fair Value US$72.52|17.1% undervalued
BL
Community Contributor
Cooling the Champions: The Aussie Tech Behind F1's Victories
Fair Value AU$12.40|38.7% undervalued
TR
Community Contributor