
Advertisement
- United States
- /
- Biotech
- /
- NasdaqGS:SRPT
Sarepta Therapeutics, Inc. (NASDAQ:SRPT) Shares Fly 29% But Investors Aren't Buying For Growth
Despite an already strong run, Sarepta Therapeutics, Inc. (NASDAQ:SRPT) shares have been powering on, with a gain of 29% in the last thirty days. Unfortunately, despite the strong performance over the last month, the full year gain of 3.9% isn't as attractive.
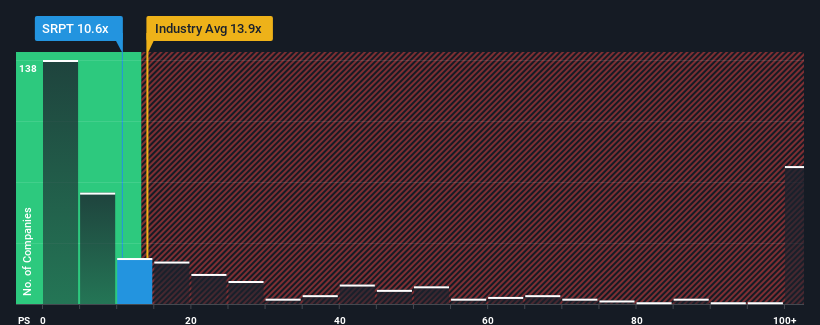
Even after such a large jump in price, Sarepta Therapeutics' price-to-sales (or "P/S") ratio of 10.6x might still make it look like a buy right now compared to the Biotechs industry in the United States, where around half of the companies have P/S ratios above 13.9x and even P/S above 56x are quite common. Nonetheless, we'd need to dig a little deeper to determine if there is a rational basis for the reduced P/S.
See our latest analysis for Sarepta Therapeutics
How Has Sarepta Therapeutics Performed Recently?
Recent times haven't been great for Sarepta Therapeutics as its revenue has been rising slower than most other companies. It seems that many are expecting the uninspiring revenue performance to persist, which has repressed the growth of the P/S ratio. If you still like the company, you'd be hoping revenue doesn't get any worse and that you could pick up some stock while it's out of favour.
Want the full picture on analyst estimates for the company? Then our free report on Sarepta Therapeutics will help you uncover what's on the horizon.What Are Revenue Growth Metrics Telling Us About The Low P/S?
There's an inherent assumption that a company should underperform the industry for P/S ratios like Sarepta Therapeutics' to be considered reasonable.
If we review the last year of revenue growth, the company posted a terrific increase of 26%. The latest three year period has also seen an excellent 123% overall rise in revenue, aided by its short-term performance. Accordingly, shareholders would have definitely welcomed those medium-term rates of revenue growth.
Turning to the outlook, the next three years should generate growth of 46% each year as estimated by the analysts watching the company. That's shaping up to be materially lower than the 231% each year growth forecast for the broader industry.
With this in consideration, its clear as to why Sarepta Therapeutics' P/S is falling short industry peers. Apparently many shareholders weren't comfortable holding on while the company is potentially eyeing a less prosperous future.
What Does Sarepta Therapeutics' P/S Mean For Investors?
Sarepta Therapeutics' stock price has surged recently, but its but its P/S still remains modest. It's argued the price-to-sales ratio is an inferior measure of value within certain industries, but it can be a powerful business sentiment indicator.
As expected, our analysis of Sarepta Therapeutics' analyst forecasts confirms that the company's underwhelming revenue outlook is a major contributor to its low P/S. Shareholders' pessimism on the revenue prospects for the company seems to be the main contributor to the depressed P/S. Unless these conditions improve, they will continue to form a barrier for the share price around these levels.
It's always necessary to consider the ever-present spectre of investment risk. We've identified 1 warning sign with Sarepta Therapeutics, and understanding should be part of your investment process.
If companies with solid past earnings growth is up your alley, you may wish to see this free collection of other companies with strong earnings growth and low P/E ratios.
New: Manage All Your Stock Portfolios in One Place
We've created the ultimate portfolio companion for stock investors, and it's free.
• Connect an unlimited number of Portfolios and see your total in one currency
• Be alerted to new Warning Signs or Risks via email or mobile
• Track the Fair Value of your stocks
Have feedback on this article? Concerned about the content? Get in touch with us directly. Alternatively, email editorial-team (at) simplywallst.com.
This article by Simply Wall St is general in nature. We provide commentary based on historical data and analyst forecasts only using an unbiased methodology and our articles are not intended to be financial advice. It does not constitute a recommendation to buy or sell any stock, and does not take account of your objectives, or your financial situation. We aim to bring you long-term focused analysis driven by fundamental data. Note that our analysis may not factor in the latest price-sensitive company announcements or qualitative material. Simply Wall St has no position in any stocks mentioned.
About NasdaqGS:SRPT
Sarepta Therapeutics
A commercial-stage biopharmaceutical company, focuses on the discovery and development of RNA-targeted therapeutics, gene therapies, and other genetic therapeutic modalities for the treatment of rare diseases.
Undervalued with adequate balance sheet.
Similar Companies
Market Insights

Advertisement
Community Narratives
The company that turned a verb into a global necessity and basically runs the modern internet, digital ads, smartphones, maps, and AI.
Fair Value US$300.00|6.3% undervalued
OS
Community Contributor
Flowers Foods Pays A Fair Price For Health
Fair Value US$16.12|26.0% undervalued
NV
Community Contributor
TMX Group will thrive with 33.3% profit margin and enduring market moat
Fair Value CA$49.90|3.7% overvalued
LI
Community Contributor