- United States
- /
- Pharma
- /
- NasdaqGM:SIGA
Investors one-year losses continue as SIGA Technologies (NASDAQ:SIGA) dips a further 12% this week, earnings continue to decline


Investors can approximate the average market return by buying an index fund. While individual stocks can be big winners, plenty more fail to generate satisfactory returns. Investors in SIGA Technologies, Inc. (NASDAQ:SIGA) have tasted that bitter downside in the last year, as the share price dropped 41%. That's well below the market return of 11%. However, the longer term returns haven't been so bad, with the stock down 24% in the last three years. And the share price decline continued over the last week, dropping some 12%.
Since SIGA Technologies has shed US$51m from its value in the past 7 days, let's see if the longer term decline has been driven by the business' economics.
While markets are a powerful pricing mechanism, share prices reflect investor sentiment, not just underlying business performance. One imperfect but simple way to consider how the market perception of a company has shifted is to compare the change in the earnings per share (EPS) with the share price movement.
Unfortunately SIGA Technologies reported an EPS drop of 13% for the last year. This reduction in EPS is not as bad as the 41% share price fall. So it seems the market was too confident about the business, a year ago. The less favorable sentiment is reflected in its current P/E ratio of 6.66.
The image below shows how EPS has tracked over time (if you click on the image you can see greater detail).
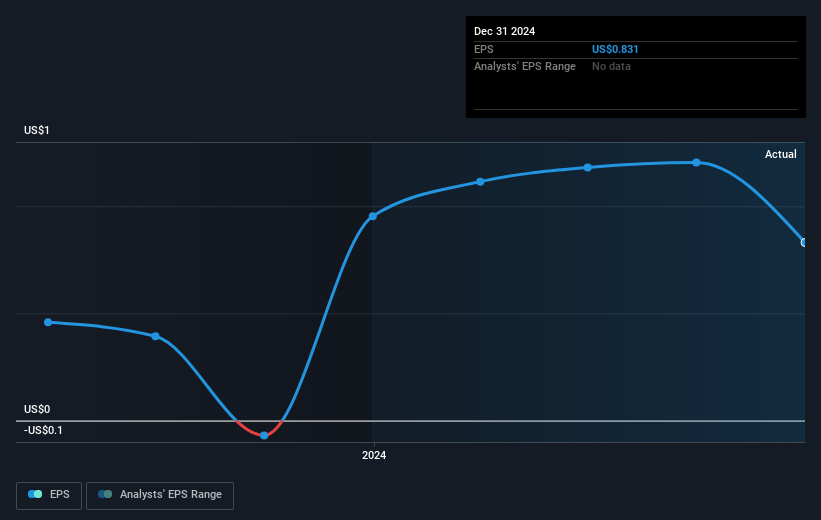
This free interactive report on SIGA Technologies' earnings, revenue and cash flow is a great place to start, if you want to investigate the stock further.
What About Dividends?
As well as measuring the share price return, investors should also consider the total shareholder return (TSR). The TSR is a return calculation that accounts for the value of cash dividends (assuming that any dividend received was reinvested) and the calculated value of any discounted capital raisings and spin-offs. Arguably, the TSR gives a more comprehensive picture of the return generated by a stock. We note that for SIGA Technologies the TSR over the last 1 year was -35%, which is better than the share price return mentioned above. This is largely a result of its dividend payments!
A Different Perspective
While the broader market gained around 11% in the last year, SIGA Technologies shareholders lost 35% (even including dividends). Even the share prices of good stocks drop sometimes, but we want to see improvements in the fundamental metrics of a business, before getting too interested. On the bright side, long term shareholders have made money, with a gain of 5% per year over half a decade. If the fundamental data continues to indicate long term sustainable growth, the current sell-off could be an opportunity worth considering. Importantly, we haven't analysed SIGA Technologies' dividend history. This free visual report on its dividends is a must-read if you're thinking of buying.
If you like to buy stocks alongside management, then you might just love this free list of companies. (Hint: many of them are unnoticed AND have attractive valuation).
Please note, the market returns quoted in this article reflect the market weighted average returns of stocks that currently trade on American exchanges.
If you're looking to trade SIGA Technologies, open an account with the lowest-cost platform trusted by professionals, Interactive Brokers.
With clients in over 200 countries and territories, and access to 160 markets, IBKR lets you trade stocks, options, futures, forex, bonds and funds from a single integrated account.
Enjoy no hidden fees, no account minimums, and FX conversion rates as low as 0.03%, far better than what most brokers offer.
Sponsored ContentNew: Manage All Your Stock Portfolios in One Place
We've created the ultimate portfolio companion for stock investors, and it's free.
• Connect an unlimited number of Portfolios and see your total in one currency
• Be alerted to new Warning Signs or Risks via email or mobile
• Track the Fair Value of your stocks
Have feedback on this article? Concerned about the content? Get in touch with us directly. Alternatively, email editorial-team (at) simplywallst.com.
This article by Simply Wall St is general in nature. We provide commentary based on historical data and analyst forecasts only using an unbiased methodology and our articles are not intended to be financial advice. It does not constitute a recommendation to buy or sell any stock, and does not take account of your objectives, or your financial situation. We aim to bring you long-term focused analysis driven by fundamental data. Note that our analysis may not factor in the latest price-sensitive company announcements or qualitative material. Simply Wall St has no position in any stocks mentioned.
About NasdaqGM:SIGA
SIGA Technologies
A commercial-stage pharmaceutical company, focuses on the health security market in the United States.
Flawless balance sheet with acceptable track record.
Similar Companies
Market Insights

Community Narratives

