Advertisement
- United States
- /
- Biotech
- /
- NasdaqGM:RNA
Assessing Avidity Biosciences After Its 54% Surge and New Clinical Milestone in 2025

Simply Wall St
Reviewed by Bailey Pemberton
Thinking about what to do with Avidity Biosciences stock right now? You are not alone, especially with the stock grabbing attention for its breakout run lately. If you have been following the biotech sector, you have probably noticed that Avidity Biosciences is one of those names that keeps popping up in discussions about innovation, partnerships, and long-term potential. In the past year, shares are up just 3.1%, but if you zoom out, the growth story is noticeable, with returns at 201.0% over three years and a healthy 77.4% over five years. Just this year, the stock price has surged 54.4% year-to-date, including a strong 7.6% gain in the last month, making it clear there is renewed optimism around the company's prospects.
Some of this momentum can be tied to wider market enthusiasm for drug development platforms and recent regulatory attention given to similar biotech firms. Investors are starting to picture a brighter and potentially less risky future for companies like Avidity. But as the price continues to move up, is all this excitement actually justified by the numbers? On a straightforward value score, Avidity comes in at 1 out of 6 checks for undervaluation, meaning it is currently seen as undervalued in just one major category. Does that tell the full story? Maybe not. In the next section, I am going to walk you through the different ways investors look at valuation, and hint at a smarter approach still to come.
Avidity Biosciences scores just 1/6 on our valuation checks. See what other red flags we found in the full valuation breakdown.
Approach 1: Avidity Biosciences Discounted Cash Flow (DCF) Analysis
The Discounted Cash Flow (DCF) model estimates a company's value by projecting its future cash flows and discounting them back to the present day. With Avidity Biosciences, the current Free Cash Flow stands at -$496.6 million, which means the company is still burning cash rather than generating it. Analysts expect this situation to gradually improve, with projections showing a move into positive territory by 2029, where Free Cash Flow is estimated at $127.0 million. While analyst estimates only extend five years, further forecasts have been extrapolated to provide a ten-year perspective, suggesting continued growth from that point onward.
Based on this cash flow path and using the 2 Stage Free Cash Flow to Equity model, the DCF analysis estimates an intrinsic fair value of $35.65 per share. However, with the implied DCF discount at -35.0%, this model suggests Avidity Biosciences is currently overvalued by about one third compared to its calculated fair value.
Result: OVERVALUED
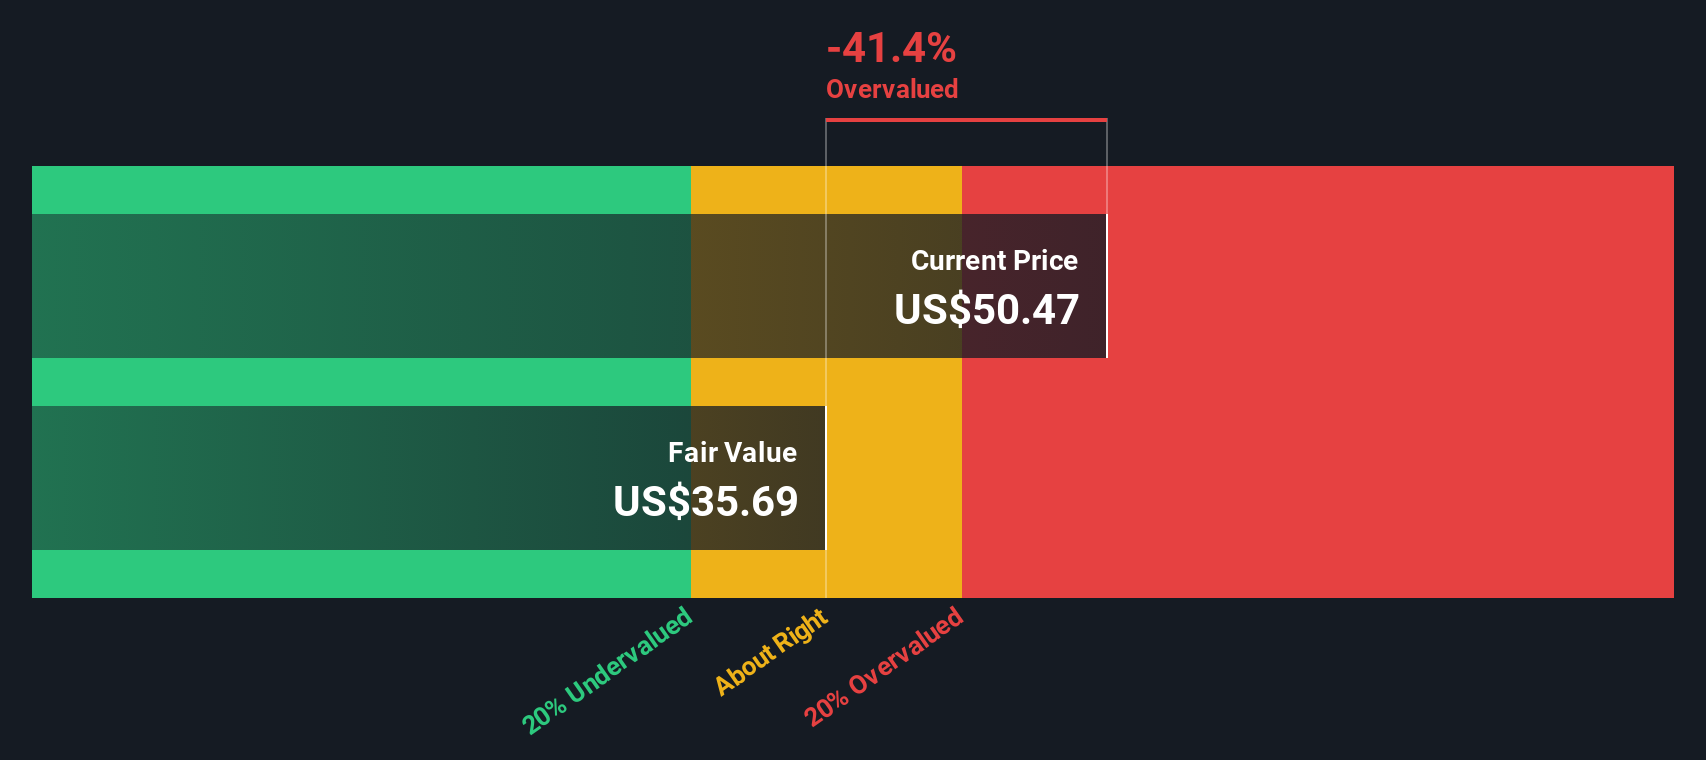
Our Discounted Cash Flow (DCF) analysis suggests Avidity Biosciences may be overvalued by 35.0%. Find undervalued stocks or create your own screener to find better value opportunities.
Approach 2: Avidity Biosciences Price vs Book
The price-to-book (PB) ratio is a popular tool for valuing biotech companies like Avidity Biosciences, especially when they have negative earnings and future profits are still on the horizon. For profitable companies, the PB ratio can help investors understand what the market is willing to pay compared to the company’s net assets, a useful proxy for value when profits are inconsistent or negative.
Growth expectations and perceived risk play an important role in what constitutes a "fair" PB ratio. In markets where investors expect rapid growth or see lower risks, PB ratios tend to be higher. By contrast, if a company faces larger uncertainties or has limited growth potential, its PB ratio will often be lower compared to peers.
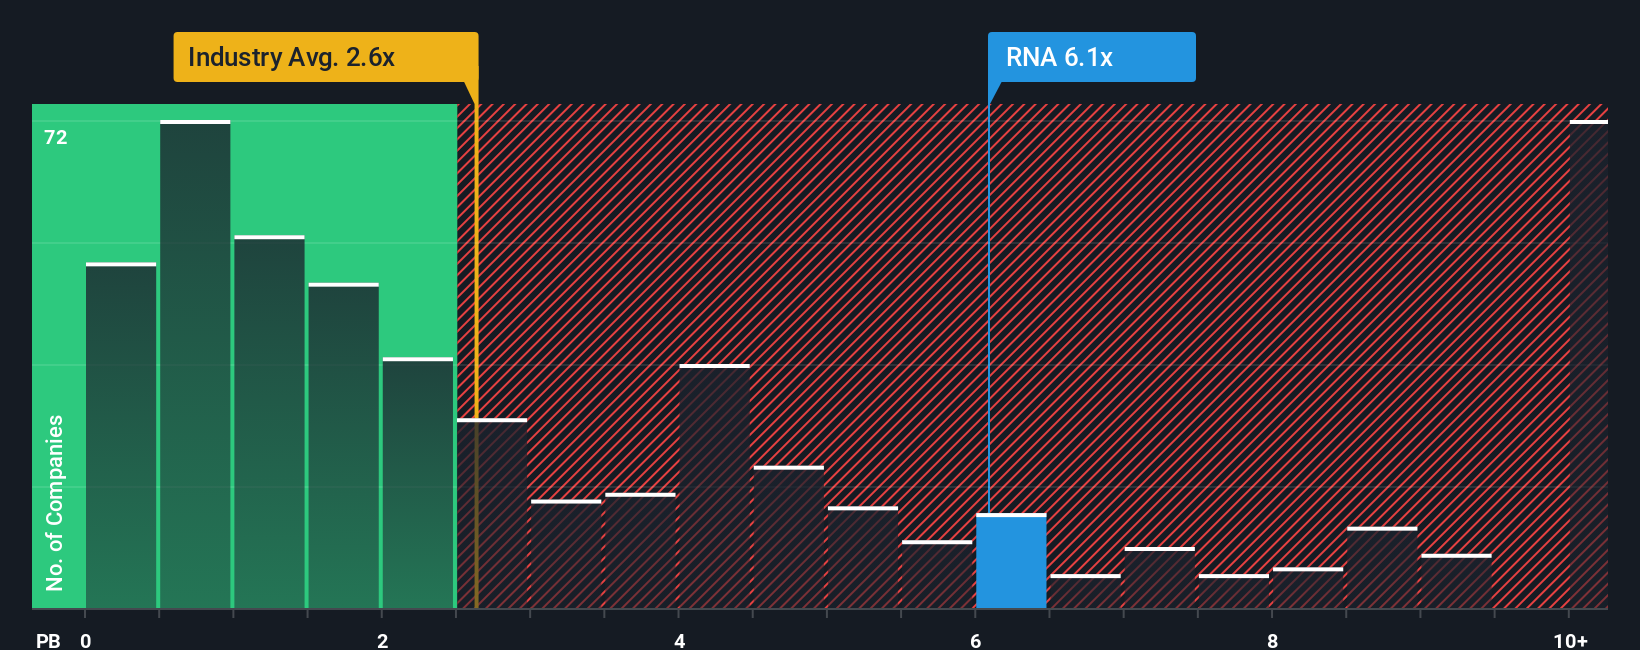
Currently, Avidity Biosciences trades at a PB ratio of 5.80x, which is below the average of its biotech peers at 9.39x but noticeably above the broader biotech industry average of 2.51x. Comparing only to peers or the industry gives a rough idea of value, but these benchmarks do not account for the company’s unique profile.
This is where Simply Wall St’s “Fair Ratio” comes in. This proprietary measure weighs multiple factors such as growth outlook, risk, profit margin, industry context, and market cap to calculate a PB ratio tailored for Avidity Biosciences. This approach gives a more holistic view than raw peer or industry comparisons, especially for growth companies with lumpy financials.
Based on this fair benchmark, Avidity’s PB ratio sits within a reasonable range of its “Fair Ratio,” suggesting the valuation is about right for its risk-return profile at present.
Result: ABOUT RIGHT
PB ratios tell one story, but what if the real opportunity lies elsewhere? Discover companies where insiders are betting big on explosive growth.
Upgrade Your Decision Making: Choose your Avidity Biosciences Narrative
Earlier we mentioned that there is an even better way to understand valuation. Let us introduce you to Narratives. A Narrative is your unique investment story for a company, combining your perspective with concrete financial forecasts such as fair value, estimated future revenue, earnings, and margins. Narratives link what you believe about a company’s potential, translate it into financial numbers, and then show a clear fair value. This approach makes it much easier to see if a stock is overvalued or undervalued right now.
Narratives are easy to use and available within the Community page on Simply Wall St, where millions of investors are already sharing their views. By comparing each Narrative’s fair value to the current price, you get a quick snapshot to help decide whether to buy or sell. In addition, Narratives update automatically as new information such as news or earnings comes in, keeping your analysis relevant at all times.
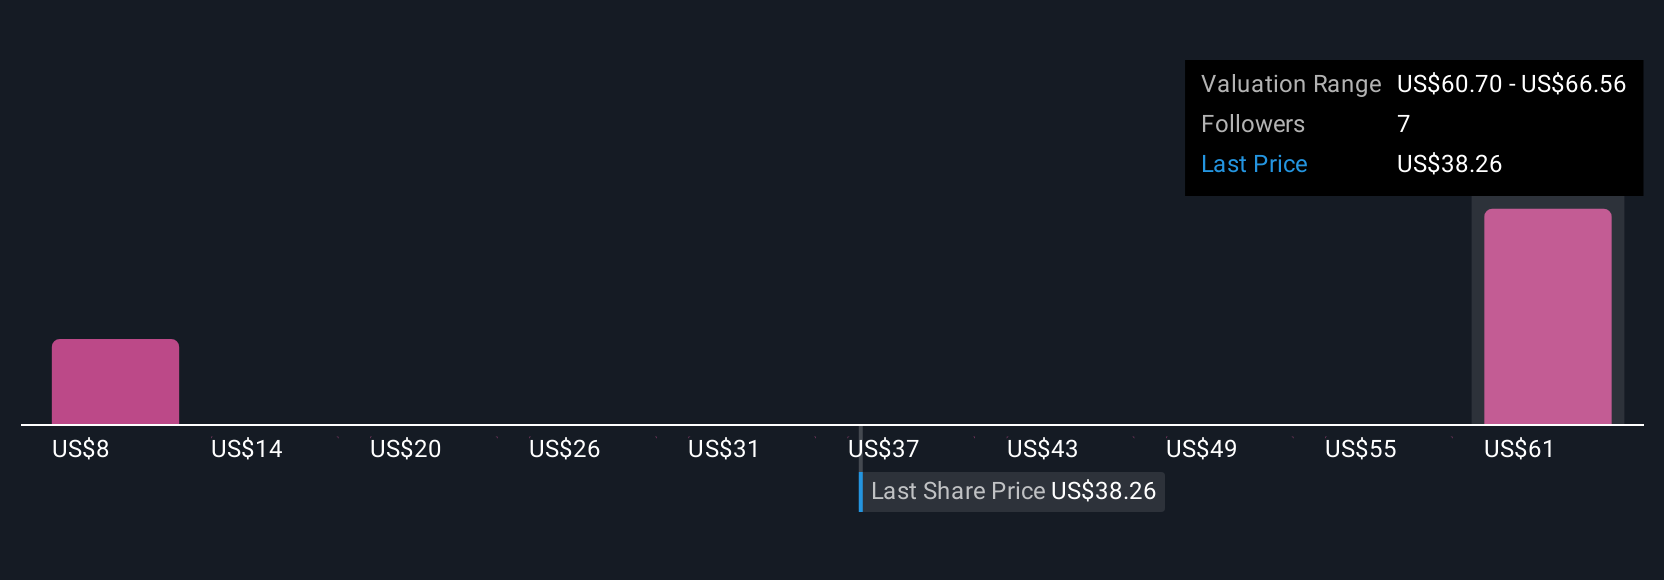
For example, some investors see significant upside for Avidity Biosciences, with fair value forecasts as high as $70 per share, while others are more cautious, setting it closer to $22 per share. Narratives make it simple to see these differing outlooks side by side, helping you make smarter and more confident decisions.
Do you think there's more to the story for Avidity Biosciences? Create your own Narrative to let the Community know!
This article by Simply Wall St is general in nature. We provide commentary based on historical data and analyst forecasts only using an unbiased methodology and our articles are not intended to be financial advice. It does not constitute a recommendation to buy or sell any stock, and does not take account of your objectives, or your financial situation. We aim to bring you long-term focused analysis driven by fundamental data. Note that our analysis may not factor in the latest price-sensitive company announcements or qualitative material. Simply Wall St has no position in any stocks mentioned.
New: Manage All Your Stock Portfolios in One Place
We've created the ultimate portfolio companion for stock investors, and it's free.
• Connect an unlimited number of Portfolios and see your total in one currency
• Be alerted to new Warning Signs or Risks via email or mobile
• Track the Fair Value of your stocks
Have feedback on this article? Concerned about the content? Get in touch with us directly. Alternatively, email editorial-team@simplywallst.com
About NasdaqGM:RNA
Avidity Biosciences
A biopharmaceutical company, engages in the delivery of RNA therapeutics called antibody oligonucleotide conjugates (AOCs).
Flawless balance sheet with low risk.
Similar Companies
Market Insights

Advertisement
Community Narratives
A formidable player in AI and enterprise computing.
Fair Value US$210.00|3.9% overvalued
CO
Community Contributor
IREN's Bold Moves in Sustainable Bitcoin Mining & AI Data Centers
Fair Value US$89.00|21.8% undervalued
BL
Community Contributor
Cooling the Champions: The Aussie Tech Behind F1's Victories
Fair Value AU$12.40|40.6% undervalued
TR
Community Contributor