- United States
- /
- Biotech
- /
- NasdaqGS:RIGL
Lacklustre Performance Is Driving Rigel Pharmaceuticals, Inc.'s (NASDAQ:RIGL) 28% Price Drop

Rigel Pharmaceuticals, Inc. (NASDAQ:RIGL) shares have retraced a considerable 28% in the last month, reversing a fair amount of their solid recent performance. Looking at the bigger picture, even after this poor month the stock is up 37% in the last year.
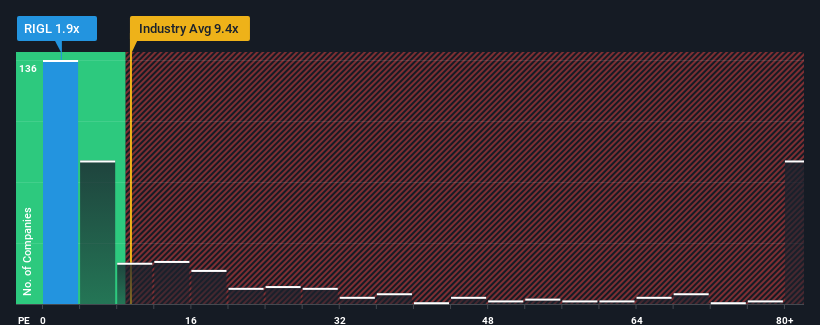
Even after such a large drop in price, Rigel Pharmaceuticals' price-to-sales (or "P/S") ratio of 1.9x might still make it look like a strong buy right now compared to the wider Biotechs industry in the United States, where around half of the companies have P/S ratios above 9.4x and even P/S above 60x are quite common. Nonetheless, we'd need to dig a little deeper to determine if there is a rational basis for the highly reduced P/S.
Check out our latest analysis for Rigel Pharmaceuticals

What Does Rigel Pharmaceuticals' P/S Mean For Shareholders?
Recent times haven't been great for Rigel Pharmaceuticals as its revenue has been rising slower than most other companies. Perhaps the market is expecting the current trend of poor revenue growth to continue, which has kept the P/S suppressed. If you still like the company, you'd be hoping revenue doesn't get any worse and that you could pick up some stock while it's out of favour.
If you'd like to see what analysts are forecasting going forward, you should check out our free report on Rigel Pharmaceuticals.Is There Any Revenue Growth Forecasted For Rigel Pharmaceuticals?
Rigel Pharmaceuticals' P/S ratio would be typical for a company that's expected to deliver very poor growth or even falling revenue, and importantly, perform much worse than the industry.
Taking a look back first, we see that the company grew revenue by an impressive 22% last year. The latest three year period has also seen a 14% overall rise in revenue, aided extensively by its short-term performance. Accordingly, shareholders would have probably been satisfied with the medium-term rates of revenue growth.
Shifting to the future, estimates from the six analysts covering the company suggest revenue should grow by 16% per year over the next three years. With the industry predicted to deliver 114% growth each year, the company is positioned for a weaker revenue result.
With this information, we can see why Rigel Pharmaceuticals is trading at a P/S lower than the industry. It seems most investors are expecting to see limited future growth and are only willing to pay a reduced amount for the stock.
What Does Rigel Pharmaceuticals' P/S Mean For Investors?
Shares in Rigel Pharmaceuticals have plummeted and its P/S has followed suit. It's argued the price-to-sales ratio is an inferior measure of value within certain industries, but it can be a powerful business sentiment indicator.
As we suspected, our examination of Rigel Pharmaceuticals' analyst forecasts revealed that its inferior revenue outlook is contributing to its low P/S. At this stage investors feel the potential for an improvement in revenue isn't great enough to justify a higher P/S ratio. It's hard to see the share price rising strongly in the near future under these circumstances.
We don't want to rain on the parade too much, but we did also find 3 warning signs for Rigel Pharmaceuticals (2 are a bit unpleasant!) that you need to be mindful of.
If strong companies turning a profit tickle your fancy, then you'll want to check out this free list of interesting companies that trade on a low P/E (but have proven they can grow earnings).
New: AI Stock Screener & Alerts
Our new AI Stock Screener scans the market every day to uncover opportunities.
• Dividend Powerhouses (3%+ Yield)
• Undervalued Small Caps with Insider Buying
• High growth Tech and AI Companies
Or build your own from over 50 metrics.
Have feedback on this article? Concerned about the content? Get in touch with us directly. Alternatively, email editorial-team (at) simplywallst.com.
This article by Simply Wall St is general in nature. We provide commentary based on historical data and analyst forecasts only using an unbiased methodology and our articles are not intended to be financial advice. It does not constitute a recommendation to buy or sell any stock, and does not take account of your objectives, or your financial situation. We aim to bring you long-term focused analysis driven by fundamental data. Note that our analysis may not factor in the latest price-sensitive company announcements or qualitative material. Simply Wall St has no position in any stocks mentioned.
About NasdaqGS:RIGL
Rigel Pharmaceuticals
A biotechnology company, engages in discovering, developing, and providing therapies that enhance the lives of patients with hematologic disorders and cancer.
High growth potential with acceptable track record.
Similar Companies
Market Insights
Community Narratives


