- United States
- /
- Biotech
- /
- NasdaqGS:PTCT
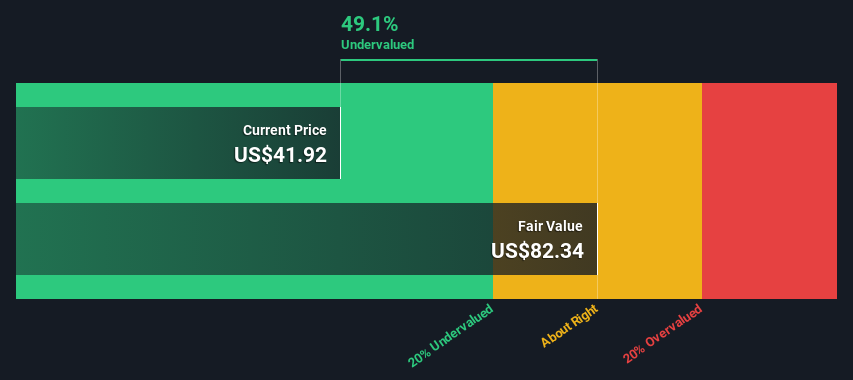
An Intrinsic Calculation For PTC Therapeutics, Inc. (NASDAQ:PTCT) Suggests It's 49% Undervalued


Key Insights
- The projected fair value for PTC Therapeutics is US$82.34 based on 2 Stage Free Cash Flow to Equity
- PTC Therapeutics' US$41.92 share price signals that it might be 49% undervalued
- Analyst price target for PTCT is US$54.20 which is 34% below our fair value estimate
In this article we are going to estimate the intrinsic value of PTC Therapeutics, Inc. (NASDAQ:PTCT) by taking the forecast future cash flows of the company and discounting them back to today's value. We will take advantage of the Discounted Cash Flow (DCF) model for this purpose. Before you think you won't be able to understand it, just read on! It's actually much less complex than you'd imagine.
We generally believe that a company's value is the present value of all of the cash it will generate in the future. However, a DCF is just one valuation metric among many, and it is not without flaws. If you still have some burning questions about this type of valuation, take a look at the Simply Wall St analysis model.
Check out our latest analysis for PTC Therapeutics
The Model
We are going to use a two-stage DCF model, which, as the name states, takes into account two stages of growth. The first stage is generally a higher growth period which levels off heading towards the terminal value, captured in the second 'steady growth' period. In the first stage we need to estimate the cash flows to the business over the next ten years. Where possible we use analyst estimates, but when these aren't available we extrapolate the previous free cash flow (FCF) from the last estimate or reported value. We assume companies with shrinking free cash flow will slow their rate of shrinkage, and that companies with growing free cash flow will see their growth rate slow, over this period. We do this to reflect that growth tends to slow more in the early years than it does in later years.
Generally we assume that a dollar today is more valuable than a dollar in the future, and so the sum of these future cash flows is then discounted to today's value:
10-year free cash flow (FCF) estimate
| 2023 | 2024 | 2025 | 2026 | 2027 | 2028 | 2029 | 2030 | 2031 | 2032 | |
| Levered FCF ($, Millions) | -US$227.5m | -US$157.5m | US$35.0m | US$417.0m | US$442.0m | US$461.4m | US$478.5m | US$493.9m | US$508.2m | US$521.6m |
| Growth Rate Estimate Source | Analyst x2 | Analyst x2 | Analyst x2 | Analyst x1 | Analyst x1 | Est @ 4.38% | Est @ 3.70% | Est @ 3.22% | Est @ 2.89% | Est @ 2.66% |
| Present Value ($, Millions) Discounted @ 7.8% | -US$211 | -US$136 | US$28.0 | US$309 | US$304 | US$295 | US$283 | US$272 | US$259 | US$247 |
("Est" = FCF growth rate estimated by Simply Wall St)
Present Value of 10-year Cash Flow (PVCF) = US$1.7b
After calculating the present value of future cash flows in the initial 10-year period, we need to calculate the Terminal Value, which accounts for all future cash flows beyond the first stage. For a number of reasons a very conservative growth rate is used that cannot exceed that of a country's GDP growth. In this case we have used the 5-year average of the 10-year government bond yield (2.1%) to estimate future growth. In the same way as with the 10-year 'growth' period, we discount future cash flows to today's value, using a cost of equity of 7.8%.
Terminal Value (TV)= FCF2032 × (1 + g) ÷ (r – g) = US$522m× (1 + 2.1%) ÷ (7.8%– 2.1%) = US$9.4b
Present Value of Terminal Value (PVTV)= TV / (1 + r)10= US$9.4b÷ ( 1 + 7.8%)10= US$4.5b
The total value is the sum of cash flows for the next ten years plus the discounted terminal value, which results in the Total Equity Value, which in this case is US$6.1b. In the final step we divide the equity value by the number of shares outstanding. Relative to the current share price of US$41.9, the company appears quite undervalued at a 49% discount to where the stock price trades currently. Remember though, that this is just an approximate valuation, and like any complex formula - garbage in, garbage out.
Important Assumptions
The calculation above is very dependent on two assumptions. The first is the discount rate and the other is the cash flows. Part of investing is coming up with your own evaluation of a company's future performance, so try the calculation yourself and check your own assumptions. The DCF also does not consider the possible cyclicality of an industry, or a company's future capital requirements, so it does not give a full picture of a company's potential performance. Given that we are looking at PTC Therapeutics as potential shareholders, the cost of equity is used as the discount rate, rather than the cost of capital (or weighted average cost of capital, WACC) which accounts for debt. In this calculation we've used 7.8%, which is based on a levered beta of 0.952. Beta is a measure of a stock's volatility, compared to the market as a whole. We get our beta from the industry average beta of globally comparable companies, with an imposed limit between 0.8 and 2.0, which is a reasonable range for a stable business.
SWOT Analysis for PTC Therapeutics
- Debt is well covered by earnings.
- Shareholders have been diluted in the past year.
- Forecast to reduce losses next year.
- Trading below our estimate of fair value by more than 20%.
- Debt is not well covered by operating cash flow.
- Has less than 3 years of cash runway based on current free cash flow.
- Total liabilities exceed total assets, which raises the risk of financial distress.
- Not expected to become profitable over the next 3 years.
Looking Ahead:
Valuation is only one side of the coin in terms of building your investment thesis, and it shouldn't be the only metric you look at when researching a company. The DCF model is not a perfect stock valuation tool. Preferably you'd apply different cases and assumptions and see how they would impact the company's valuation. If a company grows at a different rate, or if its cost of equity or risk free rate changes sharply, the output can look very different. Can we work out why the company is trading at a discount to intrinsic value? For PTC Therapeutics, we've compiled three additional aspects you should consider:
- Risks: For example, we've discovered 4 warning signs for PTC Therapeutics (1 is a bit concerning!) that you should be aware of before investing here.
- Future Earnings: How does PTCT's growth rate compare to its peers and the wider market? Dig deeper into the analyst consensus number for the upcoming years by interacting with our free analyst growth expectation chart.
- Other High Quality Alternatives: Do you like a good all-rounder? Explore our interactive list of high quality stocks to get an idea of what else is out there you may be missing!
PS. The Simply Wall St app conducts a discounted cash flow valuation for every stock on the NASDAQGS every day. If you want to find the calculation for other stocks just search here.
If you're looking to trade PTC Therapeutics, open an account with the lowest-cost platform trusted by professionals, Interactive Brokers.
With clients in over 200 countries and territories, and access to 160 markets, IBKR lets you trade stocks, options, futures, forex, bonds and funds from a single integrated account.
Enjoy no hidden fees, no account minimums, and FX conversion rates as low as 0.03%, far better than what most brokers offer.
Sponsored ContentNew: Manage All Your Stock Portfolios in One Place
We've created the ultimate portfolio companion for stock investors, and it's free.
• Connect an unlimited number of Portfolios and see your total in one currency
• Be alerted to new Warning Signs or Risks via email or mobile
• Track the Fair Value of your stocks
Have feedback on this article? Concerned about the content? Get in touch with us directly. Alternatively, email editorial-team (at) simplywallst.com.
This article by Simply Wall St is general in nature. We provide commentary based on historical data and analyst forecasts only using an unbiased methodology and our articles are not intended to be financial advice. It does not constitute a recommendation to buy or sell any stock, and does not take account of your objectives, or your financial situation. We aim to bring you long-term focused analysis driven by fundamental data. Note that our analysis may not factor in the latest price-sensitive company announcements or qualitative material. Simply Wall St has no position in any stocks mentioned.
About NasdaqGS:PTCT
PTC Therapeutics
A biopharmaceutical company, focuses on the discovery, development, and commercialization of medicines to children and adults living with rare disorders in the United States and internationally.
Undervalued slight.
Similar Companies
Market Insights

Community Narratives


